

一微米体素分辨率连续追踪小鼠全脑长距离轴突投射
染色方法:
转基因荧光标记
标记方法:
GFP、 YFP、 RFP
包埋方法:
树脂包埋
成像平台:
BioMapping 5000
cover

Fig. 1. Principles of the fMOST system. (A) Schematic of fMOST. Thin sectioning,laser scanning fluorescence imaging,and three-dimensional movement of the sample are combined to image a large-sized sample at a high resolution (see Methods). Abbreviations: AOD, acousto-optical deflector; CL, cylindrical lens; PMT, photo multiplier tube. (B) An inertia-free laser beam scanning with an acousto-optical deflector (AOD, corrected with CL) was adopted to realize long-term sample imaging with a high level of stability. (C) Confocal laser scanning fluorescence imaging was performed on a thin sample strip and was sectioned and slid along the surface of a diamond knife. (D) Stitching and stacking all of the images resulted in the generation of a complete three-dimensional dataset for the sample.
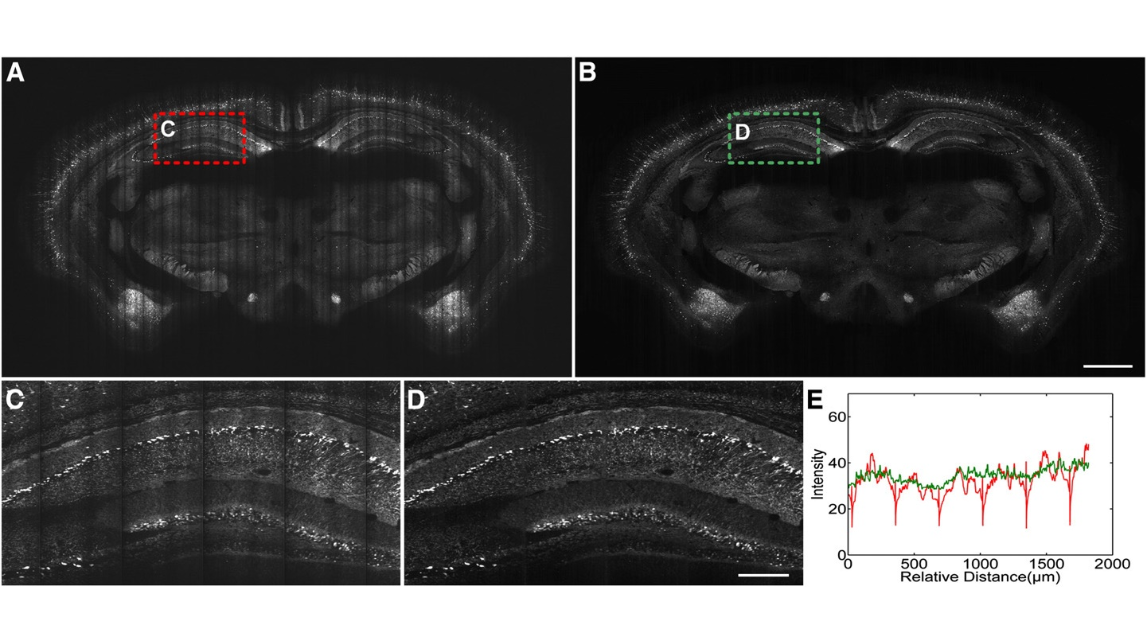
Fig. 2. Image pre-processing for the fMOST dataset. (A)The image of the original coronal section(thickness:1 μm )of an adult Thy1-eYFP-H mouse brain. (B) The image of the same section after calibrating the uneven illumination. (C) Higher magnification view of the red dashed box in (A). (D) Higher magnification view of the green dashed box in (B). (E) The mean projection curve along the vertical direction in (C) and (D). The colors of the curves correspond to those of the dashed boxes in (A) and (B). Scale bars=1 mm (A and B) and 250 μm (C and D).
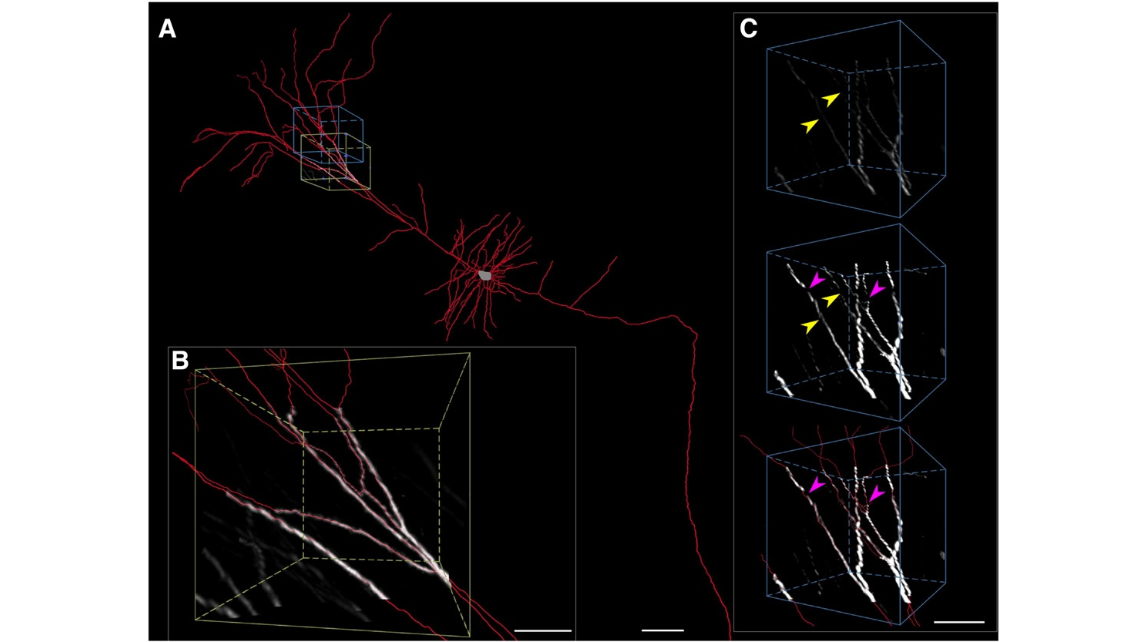
Fig. 3. Reconstruction of a long-distance projection neuron. (A) The result of reconstruction of neuron ii in Fig. 9C. (B) An enlarged view of the volume with the olive bounding box in (A) shows the automated tracing results from a high contrast of neuron segments. (C) An enlarged view of the volume with the royal blue bounding box in (A) shows the tracing of low-contrast neuron segments or missing neuron segments. Top, the original image. Middle, the image after enhancement to the brightness and contrast. Bottom, semi-automated tracing. The yellow arrowheads indicate the neurites that can be traced accurately after image enhancement. The magenta arrow indicates that a small blank appeared. This type of blank can be fixed manually with the adjacent structural features, such as the orientation and the thickness. Scale bars=100 μm (A) and 50 μm (B and C).

Fig. 4. Registration of P14-fMOST to reference P14-MRI.Three brain regions were chosen as landmarks for manual segmentation and affine registration in the Amira software. The registration was used to obtain the transformation matrix. Left, the profile of an MRI brain. Outer surfaces (dark gray), hippocampi (dark orchid), and cerebellums (sandy brown). Middle, the profile of registering the fMOST brain. Outer surfaces (medium sea green), hippocampi (spring green), and cerebellums (deep sky blue). Right, merging the profiles of the registered fMOST brain and the MRI brain. Scale bar=1 mm.
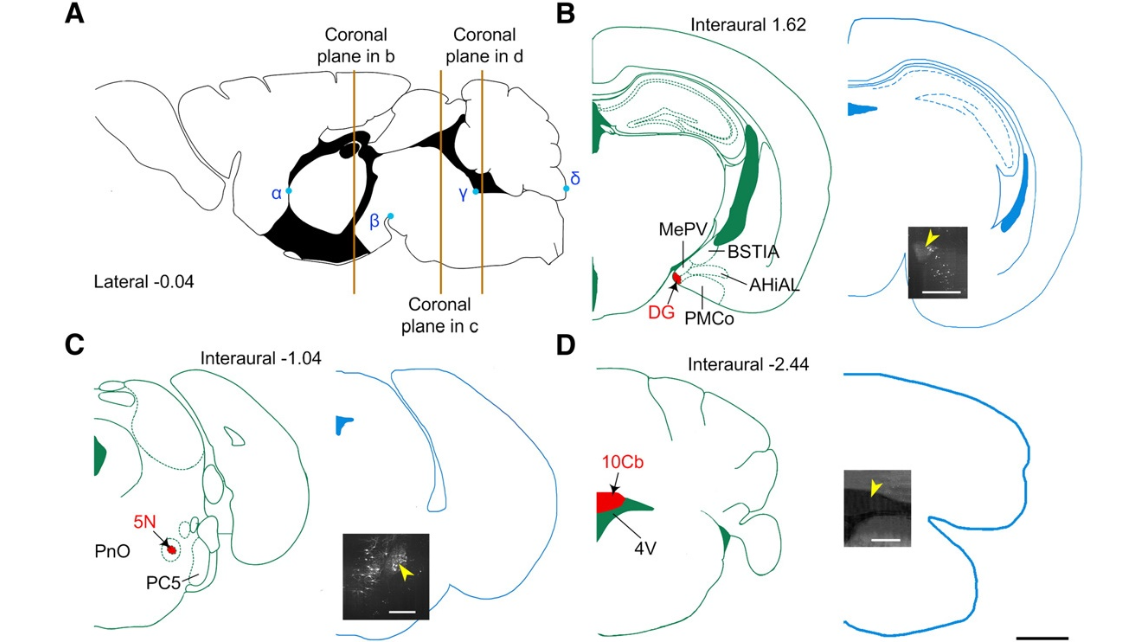
Fig. 5. Location of typical nuclei in P14-fMOST brain datasets according to FPMA. (A) The position of coronal planes that comprise the oral part of DG and 5N and the middle part of 10Cb are marked in an orange-colored line from left to right. Four anatomic points,i.e.,α,β,γ,andδ, are easily discriminated in the brain and are marked as position references in the mid-sagittal plane of the FPMA. The notation α is the junction point between the anterior commissure (ac) and the paraventricular thalamic nucleus, anterior part (PVA). The notation β is the inflection point be- tween the interfascicular nucleus (IF) and the interpeduncular nucleus, rostralsubnucleus (IPR). The notation γ is the inflection point of the 4th ventricle (4V) near the prepositus nucleus (Pr) and the dorsal raphe nucleus, ventral part(DRV).The notationδis the tangent point of the 9thcerebellarlobule (9Cb) along the dorsal–ventral direction.(B–D) Location of the coronal plane in the P14-fMOST brain datasets ,which corresponds to that in FPMA according to typical nuclei. Three typical nuclei are labeled in red in the FPMAc or on alp lanes (left in B–D),and the corresponding regions in P14-fMOST (right in B–D)are marked with yellow arrowheads. The three-dimensional coordinates of these nuclei can be obtained based on the position of the coronal plane in the whole dataset. Abbreviations: DG, dentate gyrus; 5N, motor trigeminal nucleus; 10Cb, the 10th cerebellar lobule. Scale bars=1 mm (black) and 500 μm (white).
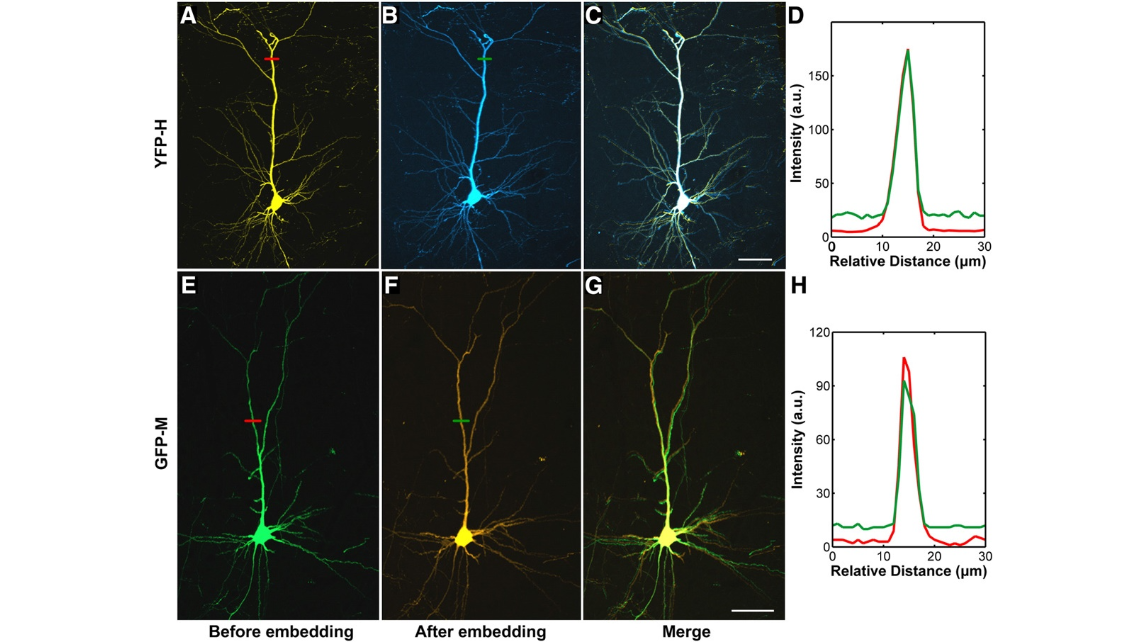
Fig. 6. Effect of GMA resin embedding on the fluorescence intensity and the microscopic structure of fluorescence-labeled brain tissue. (A, B) A typical pyramidal neuron of the Thy1-eYFP-Hmousecortexina 100-μm-thickbrainslicewas imaged with the same parameters before(A) and after(B) embedding. (C)Merged images in(A) and(B).(D) A comparison betweentheprofilesoffluorescenceintensityalongthered (A) and greenlines (B).(E–H) Similar demonstrations and results are repeated with a 100-μm-thickbrainsliceofThy1-GFP-M mouse brain. All of the images were acquired under a two-photon microscope (FV 300,Olympus;Chameleon Ultra II, Coherent; 40× water-immersion objective, NA 0.8). Each image isa max-projection of the image stacks of the brain slice. Both the eYFP and GFP sample were excited with a 925-nm laser and were imaged with Z-step of 1 μm. Scale bar=50 μm.

Fig. 7. Mouse-brain-wide fluorescence images with high resolution. (A) Sagittal image reconstructed from a stack of virtual sagittal sections (thickness:50 μm) of an adult Thy1-eYFP-Hmouse brain. The sagittal projections correspond approximately to Lateral 1.20 in the sagittal plane of the Paxinos and Franklin Mouse Atlas (PFMA) (Paxinos and Franklin, 2012). (C) Coronal image reconstructed from a stack of coronal sections (thickness: 100 μm) of an adult Thy1-GFP-M mouse brain. The coronal projections correspond approximately to Interaural 2.34 in the coronal plane of the PFMA. (B, D) Higher magnification views of some soma and fine neurites in the white box of (A) and (C). Scale bars=1 mm (A and C), 50 μm (B) and 100 μm (D).

Fig. 8. Natural registration performance of fMOST. (A) An image from the same area in Fig.9 A shows a maximum-intensity projection(thickness:672 μm)of the half coronal section. (B)Higher magnification view of the white dashed box in (A). Two typical pyramidal neurons marked with blue arrowheads correspond to neurons i and iii in Fig.9C, respectively. (C) Higher magnification view of the whitedashed box in(B). Although the sectioning inevitably interrupted the continuity of the neurite architecture within adjacent strips, the fMOST system controls this interruption within a minimal range and guarantees a registration of high quality. The neurites indicated with lime-green arrowheads have a high natural continuity; those with dark orange arrowheads have little structural blank and could be traced automatically, and those with magenta arrowheads have an apparent structural blank and could be traced in the interactive mode to guarantee structural continuity. Scale bars=500 μm (A), 200 μm (B), and 50 μm (C).
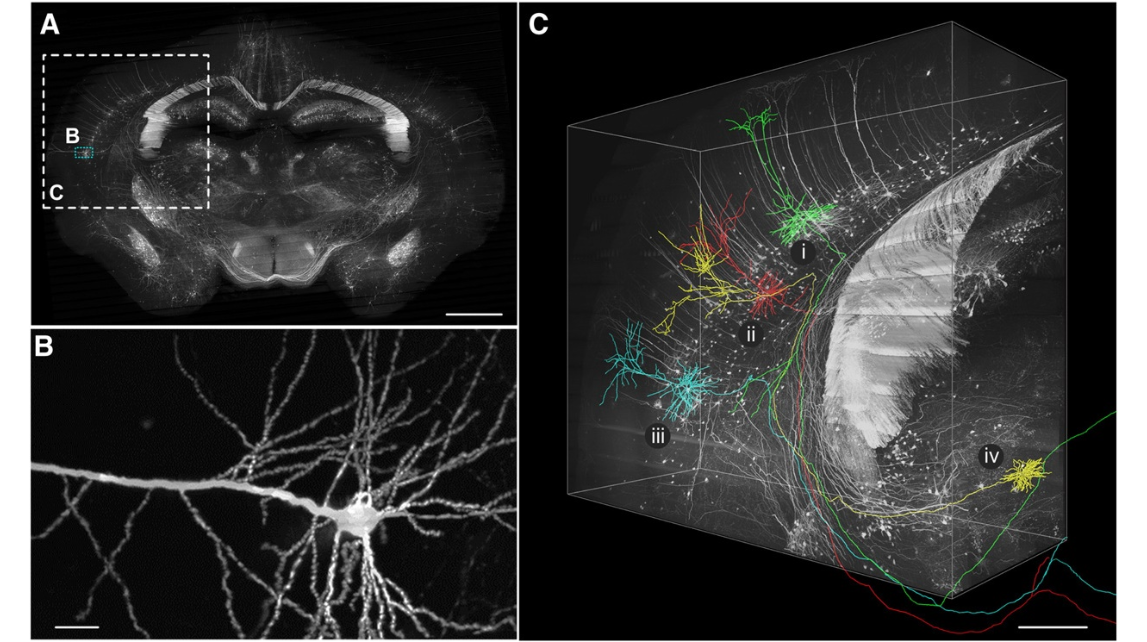
Fig. 9. Reconstruction of long-distance projection neurons in P14 Thy1-eYFP-H mouse brain. (A) Coronal image reconstructed from a stack of coronal sections (thickness: 200 μm) of an adult Thy1-eYFP-Hmousebrain.(B)A higher magnification view of part of a typical layer V pyramidal neuron in the little blue box in (A).This neuron is located in these condary somatosensory cortex and is the reconstructed projection neuron iii shown in (C). (C) High-resolution three-dimensional volume rendering of the local brain region, including the somatosensory cortex, auditory cortex, part of the hippocampus fimbria, and some regions of the thalamus in the large white dashed box in (A) (voxel size: downsampled to 1×1×2 μm 3 ; volume size: 2.5×2.1×1.0 mm 3 ). Four neurons were selected and reconstructed in the Amira software environment. These neurons were coded, and their Roman numerals (i, ii, iii, and iv) were marked near each soma. Different colors represent different neurons for facilitating observations. Scale bars=1 mm (A), 20 μm (B), and 500 μm (C).
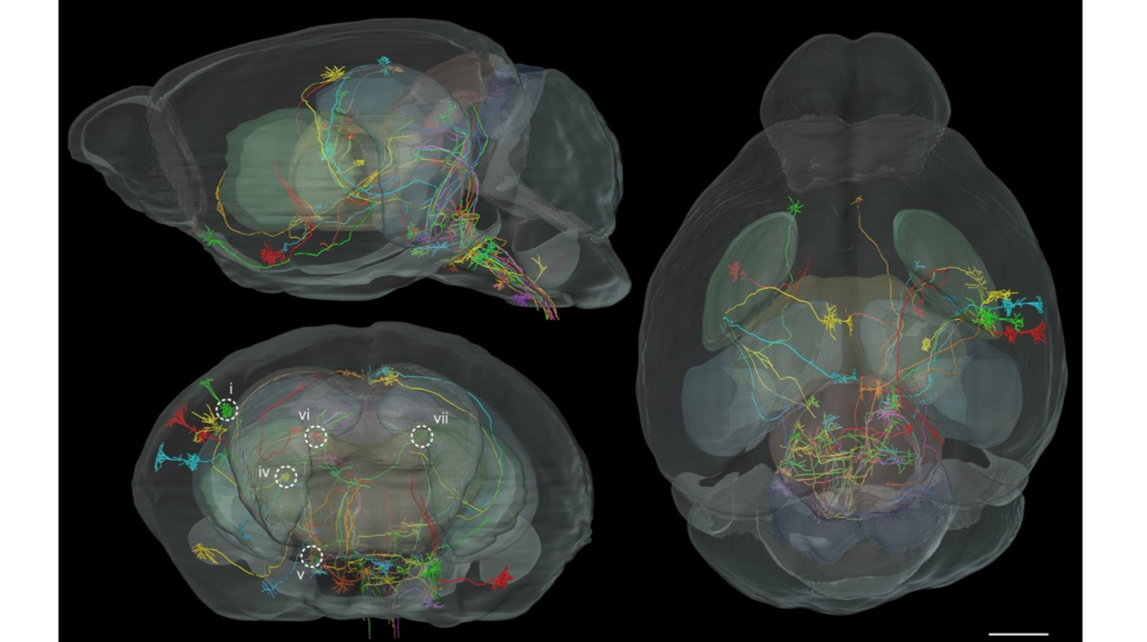
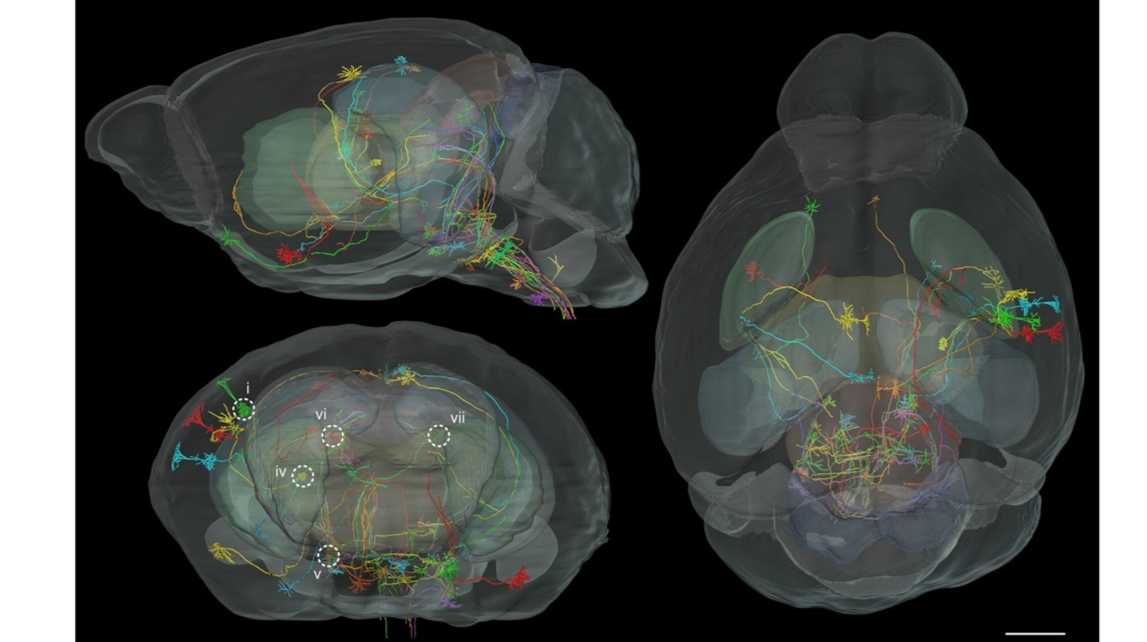
Fig. 10. Registration of long-distance projection neurons of P14 Thy1-eYFP-H mouse brain. Forty long-distance projection neurons of the same P14 Thy1-eYFP-H mouse were registered in the P14 MRI reference mouse brain. The sagittal, coronal, and horizontal views are presented separately. The coronal view is shown from the rostral perspective. Each neuron is represented in a different color to discriminate neurites from different neurons. Five of these registered neurons (i, iv, v, vi, and vii), marked by white circles in the figure on the bottom left, were selected for subsequent annotation. Scale bar=1 mm.
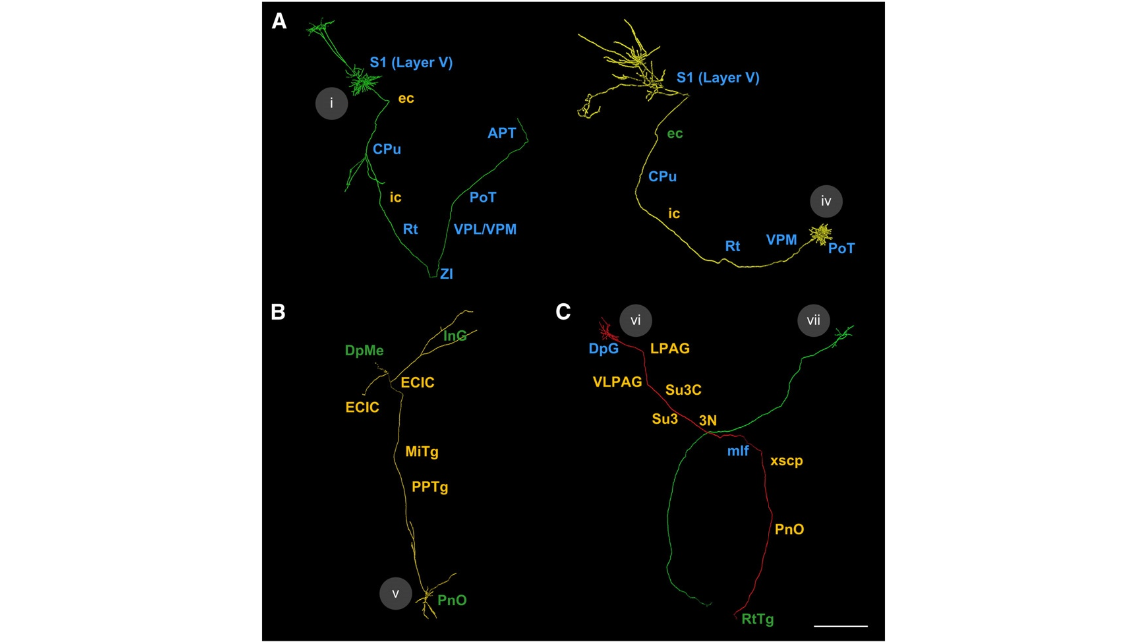
Fig. 11. Annotation of projection neurons of P14Thy1-eYFP-Hmouse in detail.(A–C) Five registered projection neurons marked in Fig.10 were annotated through our novel pipeline.Fine architectures of projections of neuron i and iv were presented in a high-resolution three-dimensional volume in Fig. 9C. The nuclei in the neural pathways were annotated seriatim. The nuclei reported in the literature in mice are marked inblue, those unknown in mice but already reported in rats in green, and those never reported in either mice or rats inorange. These neurons were coded with different colors, and their Roman numerals (i, iv, v, vi, and vii) were marked near each soma. Abbreviations: S1, primary somatosensory cortex; ec, external capsule; CPu, striatum; ic, internalcapsule; Rt, reticularthalamicnucleus; ZI,zonaincerta; VPL/VPM, ventralposterolateral/posteromedialthalamicnuclei; PoT, posteriorthalamicnuclear group, triangular part; APT, anterior pretectal nucleus; PnO, oral part of pontine reticular nucleus; PPTg, pedunculopontine tegmental nucleus; MiTg, microcellular tegmental nucleus; ECIC, external cortex of the inferior colliculus; InG, intermediate gray layer of the superior colliculus; DpMe, deep mesencephalic nucleus; DpG, deep gray layer of the superior colliculus; LPAG, lateralperiaqueductalgray; VLPAG, ventrolateralperiaqueductalgray; Su3C,
Video 1. High-resolution three-dimensional reconstruction of brain-wide axonal projections of neurons highlighted in Fig. 9C. Four reconstructed long-distance projection neurons overlain with high-resolution local volume (volume size: 2.7 × 2.7 × 1.7 mm3, voxel size: 1 × 1 × 2 μm3) are presented in this perspective. The raw data were imaged at 0.5 × 0.5 × 2.0 μm3 and then downsampled to 1 × 1 × 2 μm3 for local three-dimensional reconstruction. The local volume size and resolution were limited by the computer performance
Video 2. Three-dimensional reconstruction of multiple long-distance projection neurons presented in Fig. 10 in whole mouse brain. Forty reconstructed long-distance projection neurons overlain with P14-MRI show brain-wide neuron projections acquired by fMOST. Seven brain sub-structures are shown in different colors for location reference (olfactory bulb, cerebral cortex, and cerebellum: dark gray; caudate putamen: dark sea green; hippocampus: slate gray; thalamus: Navajo white; superior colliculus: burly wood; inferior colliculus: light steel blue)
cover
Fig. 1. Principles of the fMOST system. (A) Schematic of fMOST. Thin sectioning,laser scanning fluorescence imaging,and three-dimensional movement of the sample are combined to image a large-sized sample at a high resolution (see Methods). Abbreviations: AOD, acousto-optical deflector; CL, cylindrical lens; PMT, photo multiplier tube. (B) An inertia-free laser beam scanning with an acousto-optical deflector (AOD, corrected with CL) was adopted to realize long-term sample imaging with a high level of stability. (C) Confocal laser scanning fluorescence imaging was performed on a thin sample strip and was sectioned and slid along the surface of a diamond knife. (D) Stitching and stacking all of the images resulted in the generation of a complete three-dimensional dataset for the sample.
Fig. 2. Image pre-processing for the fMOST dataset. (A)The image of the original coronal section(thickness:1 μm )of an adult Thy1-eYFP-H mouse brain. (B) The image of the same section after calibrating the uneven illumination. (C) Higher magnification view of the red dashed box in (A). (D) Higher magnification view of the green dashed box in (B). (E) The mean projection curve along the vertical direction in (C) and (D). The colors of the curves correspond to those of the dashed boxes in (A) and (B). Scale bars=1 mm (A and B) and 250 μm (C and D).
Fig. 3. Reconstruction of a long-distance projection neuron. (A) The result of reconstruction of neuron ii in Fig. 9C. (B) An enlarged view of the volume with the olive bounding box in (A) shows the automated tracing results from a high contrast of neuron segments. (C) An enlarged view of the volume with the royal blue bounding box in (A) shows the tracing of low-contrast neuron segments or missing neuron segments. Top, the original image. Middle, the image after enhancement to the brightness and contrast. Bottom, semi-automated tracing. The yellow arrowheads indicate the neurites that can be traced accurately after image enhancement. The magenta arrow indicates that a small blank appeared. This type of blank can be fixed manually with the adjacent structural features, such as the orientation and the thickness. Scale bars=100 μm (A) and 50 μm (B and C).
Fig. 4. Registration of P14-fMOST to reference P14-MRI.Three brain regions were chosen as landmarks for manual segmentation and affine registration in the Amira software. The registration was used to obtain the transformation matrix. Left, the profile of an MRI brain. Outer surfaces (dark gray), hippocampi (dark orchid), and cerebellums (sandy brown). Middle, the profile of registering the fMOST brain. Outer surfaces (medium sea green), hippocampi (spring green), and cerebellums (deep sky blue). Right, merging the profiles of the registered fMOST brain and the MRI brain. Scale bar=1 mm.
Fig. 5. Location of typical nuclei in P14-fMOST brain datasets according to FPMA. (A) The position of coronal planes that comprise the oral part of DG and 5N and the middle part of 10Cb are marked in an orange-colored line from left to right. Four anatomic points,i.e.,α,β,γ,andδ, are easily discriminated in the brain and are marked as position references in the mid-sagittal plane of the FPMA. The notation α is the junction point between the anterior commissure (ac) and the paraventricular thalamic nucleus, anterior part (PVA). The notation β is the inflection point be- tween the interfascicular nucleus (IF) and the interpeduncular nucleus, rostralsubnucleus (IPR). The notation γ is the inflection point of the 4th ventricle (4V) near the prepositus nucleus (Pr) and the dorsal raphe nucleus, ventral part(DRV).The notationδis the tangent point of the 9thcerebellarlobule (9Cb) along the dorsal–ventral direction.(B–D) Location of the coronal plane in the P14-fMOST brain datasets ,which corresponds to that in FPMA according to typical nuclei. Three typical nuclei are labeled in red in the FPMAc or on alp lanes (left in B–D),and the corresponding regions in P14-fMOST (right in B–D)are marked with yellow arrowheads. The three-dimensional coordinates of these nuclei can be obtained based on the position of the coronal plane in the whole dataset. Abbreviations: DG, dentate gyrus; 5N, motor trigeminal nucleus; 10Cb, the 10th cerebellar lobule. Scale bars=1 mm (black) and 500 μm (white).
Fig. 6. Effect of GMA resin embedding on the fluorescence intensity and the microscopic structure of fluorescence-labeled brain tissue. (A, B) A typical pyramidal neuron of the Thy1-eYFP-Hmousecortexina 100-μm-thickbrainslicewas imaged with the same parameters before(A) and after(B) embedding. (C)Merged images in(A) and(B).(D) A comparison betweentheprofilesoffluorescenceintensityalongthered (A) and greenlines (B).(E–H) Similar demonstrations and results are repeated with a 100-μm-thickbrainsliceofThy1-GFP-M mouse brain. All of the images were acquired under a two-photon microscope (FV 300,Olympus;Chameleon Ultra II, Coherent; 40× water-immersion objective, NA 0.8). Each image isa max-projection of the image stacks of the brain slice. Both the eYFP and GFP sample were excited with a 925-nm laser and were imaged with Z-step of 1 μm. Scale bar=50 μm.
Fig. 7. Mouse-brain-wide fluorescence images with high resolution. (A) Sagittal image reconstructed from a stack of virtual sagittal sections (thickness:50 μm) of an adult Thy1-eYFP-Hmouse brain. The sagittal projections correspond approximately to Lateral 1.20 in the sagittal plane of the Paxinos and Franklin Mouse Atlas (PFMA) (Paxinos and Franklin, 2012). (C) Coronal image reconstructed from a stack of coronal sections (thickness: 100 μm) of an adult Thy1-GFP-M mouse brain. The coronal projections correspond approximately to Interaural 2.34 in the coronal plane of the PFMA. (B, D) Higher magnification views of some soma and fine neurites in the white box of (A) and (C). Scale bars=1 mm (A and C), 50 μm (B) and 100 μm (D).
Fig. 8. Natural registration performance of fMOST. (A) An image from the same area in Fig.9 A shows a maximum-intensity projection(thickness:672 μm)of the half coronal section. (B)Higher magnification view of the white dashed box in (A). Two typical pyramidal neurons marked with blue arrowheads correspond to neurons i and iii in Fig.9C, respectively. (C) Higher magnification view of the whitedashed box in(B). Although the sectioning inevitably interrupted the continuity of the neurite architecture within adjacent strips, the fMOST system controls this interruption within a minimal range and guarantees a registration of high quality. The neurites indicated with lime-green arrowheads have a high natural continuity; those with dark orange arrowheads have little structural blank and could be traced automatically, and those with magenta arrowheads have an apparent structural blank and could be traced in the interactive mode to guarantee structural continuity. Scale bars=500 μm (A), 200 μm (B), and 50 μm (C).
Fig. 9. Reconstruction of long-distance projection neurons in P14 Thy1-eYFP-H mouse brain. (A) Coronal image reconstructed from a stack of coronal sections (thickness: 200 μm) of an adult Thy1-eYFP-Hmousebrain.(B)A higher magnification view of part of a typical layer V pyramidal neuron in the little blue box in (A).This neuron is located in these condary somatosensory cortex and is the reconstructed projection neuron iii shown in (C). (C) High-resolution three-dimensional volume rendering of the local brain region, including the somatosensory cortex, auditory cortex, part of the hippocampus fimbria, and some regions of the thalamus in the large white dashed box in (A) (voxel size: downsampled to 1×1×2 μm 3 ; volume size: 2.5×2.1×1.0 mm 3 ). Four neurons were selected and reconstructed in the Amira software environment. These neurons were coded, and their Roman numerals (i, ii, iii, and iv) were marked near each soma. Different colors represent different neurons for facilitating observations. Scale bars=1 mm (A), 20 μm (B), and 500 μm (C).
Fig. 10. Registration of long-distance projection neurons of P14 Thy1-eYFP-H mouse brain. Forty long-distance projection neurons of the same P14 Thy1-eYFP-H mouse were registered in the P14 MRI reference mouse brain. The sagittal, coronal, and horizontal views are presented separately. The coronal view is shown from the rostral perspective. Each neuron is represented in a different color to discriminate neurites from different neurons. Five of these registered neurons (i, iv, v, vi, and vii), marked by white circles in the figure on the bottom left, were selected for subsequent annotation. Scale bar=1 mm.
Fig. 11. Annotation of projection neurons of P14Thy1-eYFP-Hmouse in detail.(A–C) Five registered projection neurons marked in Fig.10 were annotated through our novel pipeline.Fine architectures of projections of neuron i and iv were presented in a high-resolution three-dimensional volume in Fig. 9C. The nuclei in the neural pathways were annotated seriatim. The nuclei reported in the literature in mice are marked inblue, those unknown in mice but already reported in rats in green, and those never reported in either mice or rats inorange. These neurons were coded with different colors, and their Roman numerals (i, iv, v, vi, and vii) were marked near each soma. Abbreviations: S1, primary somatosensory cortex; ec, external capsule; CPu, striatum; ic, internalcapsule; Rt, reticularthalamicnucleus; ZI,zonaincerta; VPL/VPM, ventralposterolateral/posteromedialthalamicnuclei; PoT, posteriorthalamicnuclear group, triangular part; APT, anterior pretectal nucleus; PnO, oral part of pontine reticular nucleus; PPTg, pedunculopontine tegmental nucleus; MiTg, microcellular tegmental nucleus; ECIC, external cortex of the inferior colliculus; InG, intermediate gray layer of the superior colliculus; DpMe, deep mesencephalic nucleus; DpG, deep gray layer of the superior colliculus; LPAG, lateralperiaqueductalgray; VLPAG, ventrolateralperiaqueductalgray; Su3C,
Video 1. High-resolution three-dimensional reconstruction of brain-wide axonal projections of neurons highlighted in Fig. 9C. Four reconstructed long-distance projection neurons overlain with high-resolution local volume (volume size: 2.7 × 2.7 × 1.7 mm3, voxel size: 1 × 1 × 2 μm3) are presented in this perspective. The raw data were imaged at 0.5 × 0.5 × 2.0 μm3 and then downsampled to 1 × 1 × 2 μm3 for local three-dimensional reconstruction. The local volume size and resolution were limited by the computer performance
Video 2. Three-dimensional reconstruction of multiple long-distance projection neurons presented in Fig. 10 in whole mouse brain. Forty reconstructed long-distance projection neurons overlain with P14-MRI show brain-wide neuron projections acquired by fMOST. Seven brain sub-structures are shown in different colors for location reference (olfactory bulb, cerebral cortex, and cerebellum: dark gray; caudate putamen: dark sea green; hippocampus: slate gray; thalamus: Navajo white; superior colliculus: burly wood; inferior colliculus: light steel blue)
2013年7月1日,华中科技大学武汉光电国家研究中心骆清铭教授课题组,使用fMOST技术,实现了在全脑范围,获得一微米体素分辨率的连续神经元投射。文章发表在《神经影像》杂志上。
参考文献
参考文献[1]:Gong H, Zeng S, Yan C, Lv X, Yang Z, Xu T, Feng Z, Ding W, Qi X, Li A, Wu J, Luo Q. Continuously tracing brain-wide long-distance axonal projections in mice at a one-micron voxel resolution. Neuroimage (2013);74:87-98.....