

AD小鼠脑血管及其在海马损伤的高分辨图谱
染色方法:
尼氏染色
标记方法:
Nissl染色
包埋方法:
树脂包埋
成像平台:
BioMapping 1000
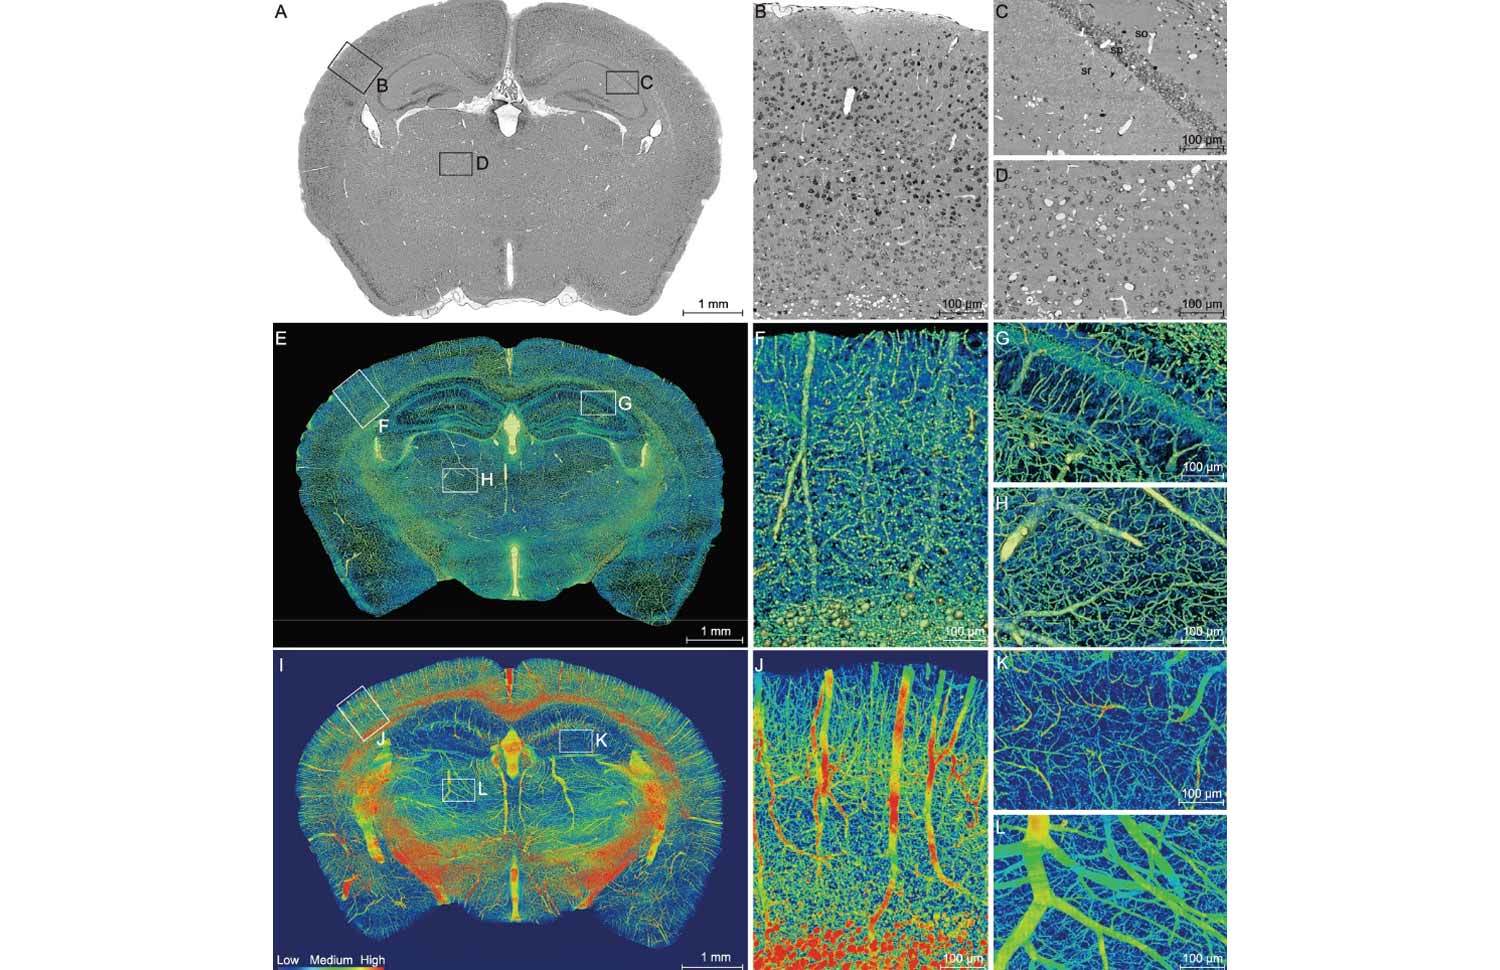
Figure 1.High-resolution brain atlas providing a global view of the complex vascular network in a C57BL/6 mouse. (A) Representative coronal section showing the cortex (B), hippocampus (C) and thalamus (D), using the whole-brain Nissl-staining method. Boxed areas in A are shown in B, C and D, revealing somata (black) and vessels (white). The stratum oriens (so), strata pyramidale (sp), strata radiatum (sr), cell layers in the hippocampus. Smaller white circles in sr, nerve processes. (E–H) An image of a 200-μm-thick coronal section of the mouse brain reconstructed using volume rendering, with gray levels color-coded. Boxed areas in the cortex F, hippocampus G and thalamus H are shown at a higher magnification. Yellow/green lines, blood vessels; green dots in sp, somata; radial blue lines in sr, dendrites. (I–L) Maximum intensity projection (MIP) of the 400-μm-thick coronal section adjacent to that shown in E, revealing only blood vessels, with the vascular volumetric density coded in color. Boxed areas of the cortex (J), hippocampus (K) and thalamus (L) are shown at a higher magnification.
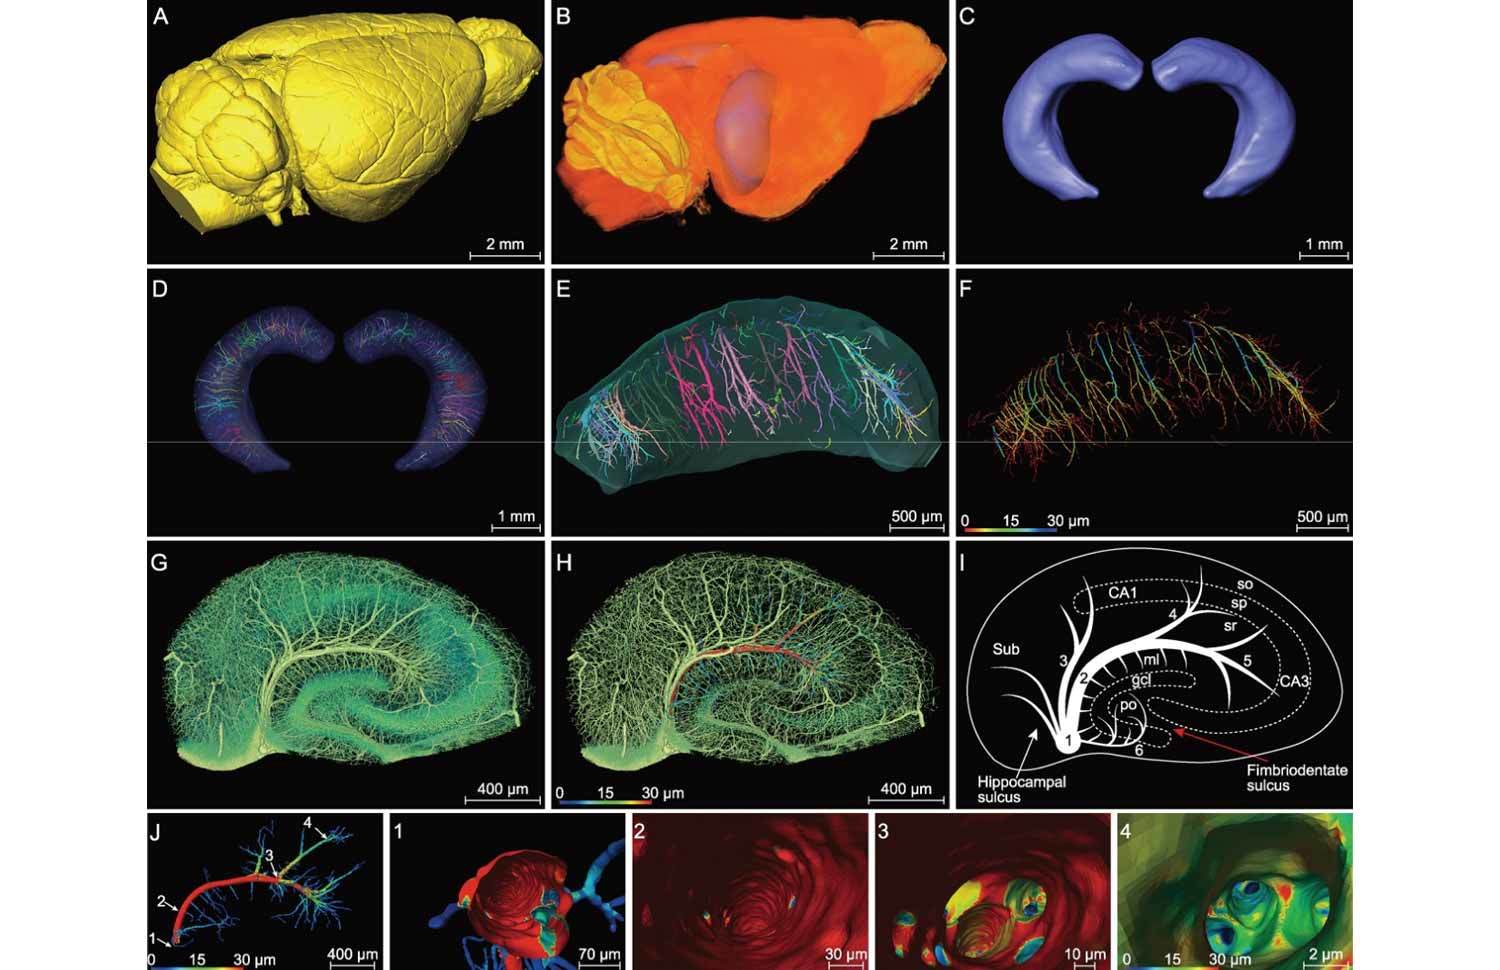
Figure 2.Segmented hippocampus for high-resolution vasculature analysis in a C57BL/6 mouse. (A) Lateral view of the 3D-reconstructed whole mouse brain, with a network of pial blood vessels visible on the surface. (B) and (C) Two segmented hippocampi from the mouse brain shown in (A), showing the location in the brain and the anterior view, respectively. (D) and (E) The inner vasculature of the bilateral hippocampi showing equally spaced transverse hippocampal vessels distributed in a rake-like pattern. Individual vessels labeled by different colors. (F) The same hippocampus as that in (E), with vessel diameters coded by colors. (G–I) Images of a hippocampal section perpendicular to the longitudinal axis, showing branches of transverse hippocampal vessels, with the gray level coded by the color in (G) (revealing both vessels, somata and nerve processes in sr). In (H), a selected vessel with the diameter of its main trunk and branches was coded for its diameters in colors (mainly vessels only). (I) Schematic diagram depicting the pattern of the transverse hippocampal vessels. 1: LHV, giving off ITHVs and ETHVs; 2: ITHA, entering the cornu ammonis by the hippocampal sulcus; 3: the branches directly generating from LHV to supply CA1; 4/5: the branches of ITHV respectively supplying CA2 and CA3; 6: ETHV, entering the dentate gyrus by penetrating the fimbriodentate sulcus. In cornu ammonis: so, stratum oriens; sp, stratum pyramidale; sr, stratum radiatum. In dentate gyrus: ml, molecular layer; po, polymorph layer; gcl, granule cell layer. (J) Representative individual hippocampal vessel the same as that shown in (H) was manually segmented, with vessel diameters coded by colors. The transverse hippocampal vessel appears like an arch with microvessels extending from its both dorsal and ventral sides. (1–4) The virtual vascular endoscopic tracking of the individual transverse hippocampal vessel. (1) Initial entry into the vessel. Subsequent images along the tracking pathway are shown in (2)–(4), revealing endovascular structures. The scale bar in each endoscopic image indicates the magnification of field of view.
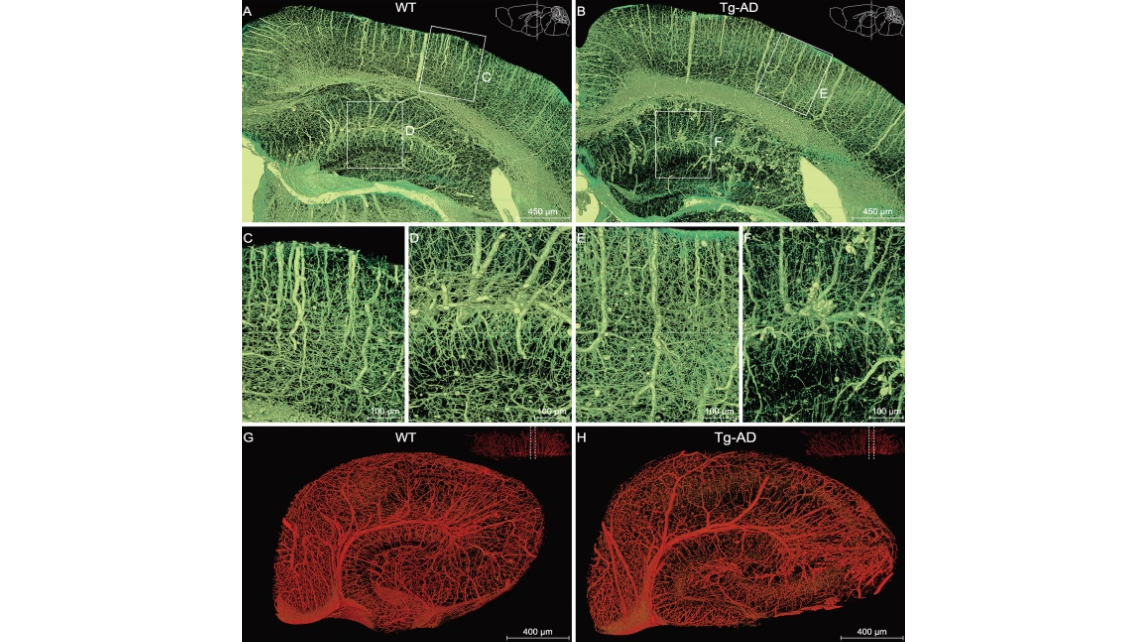
Figure 3.Comparison of the hippocampal vasculature between WT and Tg-AD mice. (A), (C), (D) and (G) WT group; (B), (E), (F) and (H) Tg-AD group. (A) and (B) Representative coronal view of the vascular network of the right hippocampus and its neighboring brain regions in WT and Tg-AD mice. The brain contours in the top-right corner indicate that the coronal slices between the two dotted lines were reconstructed. Boxed areas in the cortex ((C) and (E)) and hippocampus ((D) and (F)) are shown at a higher magnification. (G) and (H) Representative sectional views of the hippocampal vasculature perpendicular to the longitudinal hippocampal axis. The dotted lines in the top-right corner denote the data displayed in sectional view.

Figure 4.Quantitative comparison of the hippocampal vasculature between WT and Tg-AD mice. (A) and (B) The same sections as shown in Fig. 3G and H are displayed with somata, vessels and nerve processes together to facilitate the demarcation of hippocampal sub-regions. The hippocampal vasculatures were divided into four subareas based on the hippocampal functional partition including the subiculum (Sub), CA1–2, CA3 and molecular layer of the dentate gyrus (DG-ml). The quantitative analyses of the main morphometric parameters were conducted on the basis of these segmented sub-regions. (C–F) Quantitative analysis of the hippocampal vascular network. Columns and boxes in blue are the WT group; columns or boxes in red are the Tg-AD group. (C) Comparison of the mean diameter, volume fraction and length density in the whole hippocampus between WT and Tg-AD mice (unpaired t-test; *P < 0.05; ***P < 0.001; ns, non-significant, P > 0.05; n = 3 mice per group). (D–F) Comparison of the mean diameter, volume fraction and length density in the four segmented sub-regions between the WT and Tg-AD mice (unpaired t-test; *P < 0.05; **P < 0.01; ***P < 0.001; ns, non-significant, P > 0.05; n = 2 sections per mouse for three WT mice and three Tg-AD mice). Error bars in (C) represent s.e.m.; error bars in (D–F) represent the greatest value (above) and lowest value (below).
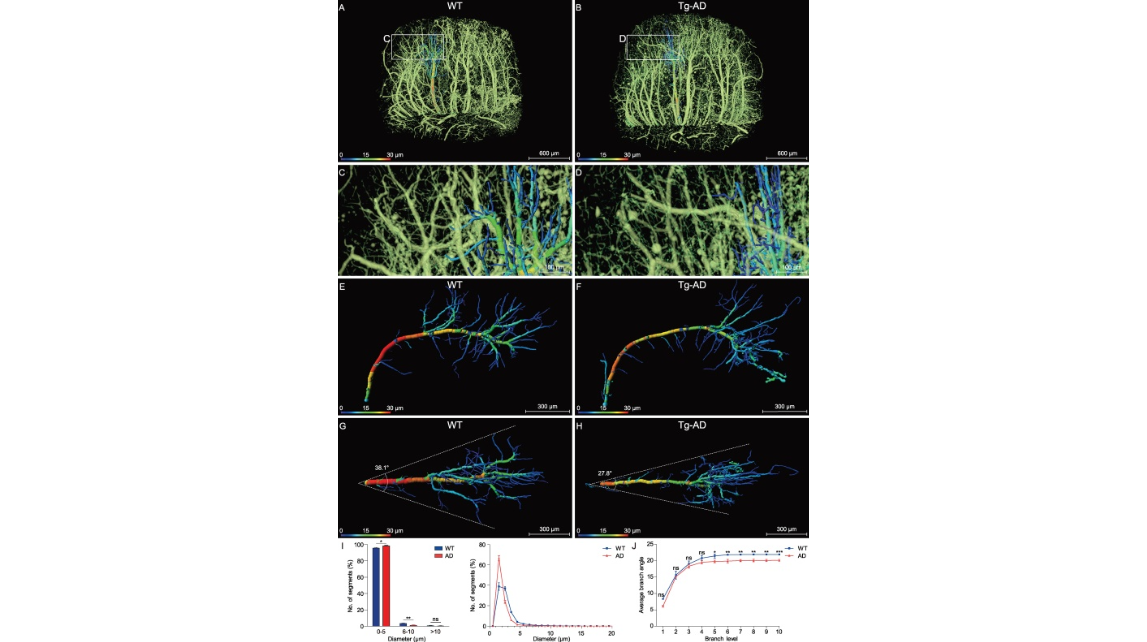
Figure 5.Analysis of the morphology and architecture in an individual hippocampal vessel. (A), (C), (E) and (G) WT group; (B), (D), (F) and (H) Tg-AD group. (A) and (B) The two middle hippocampal regions were extracted from the WT and Tg-AD mice in similar spatial positions. (C) and (D) Enlarged views of the boxes in (A) and (B) show the distal end of the transverse hippocampal vessels. (E) and (F) The individual hippocampal vessels were segmented manually from (A) and (B) and displayed from a lateral view, with the vessel diameters coded by colors. (G) and (H) The top view of the same vessel as shown in (E) and (F). The divergent angle of the single vascular branch is 38.1° in the WT group and 27.8° in the Tg-AD group. (I) and (J) Columns or lines in blue are the WT group; columns or lines in red are the Tg-AD group. (I) Quantitative comparison of the percentage of the number of vascular segments with different diameters (0–20 μm) between the WT and Tg-AD mice. The 98.3% number of the vascular segments was below 5 μm in the Tg-AD mice and 95.7% in the WT mice (unpaired t-test; *P < 0.05; **P < 0.01; ns, non-significant; P > 0.05; n = 3 mice per group). (J) Quantitative comparison of the average branching angles with different branch levels between the WT and Tg-AD mice. The average branch angles in the Tg-AD mice were significantly decreased beginning at branch level 5 (unpaired t-test; *P < 0.05; **P < 0.01; ***P < 0.001; ns, non-significant, P > 0.05; n = 3 mice per group). Error bars in (I) and (J) represent s.d.
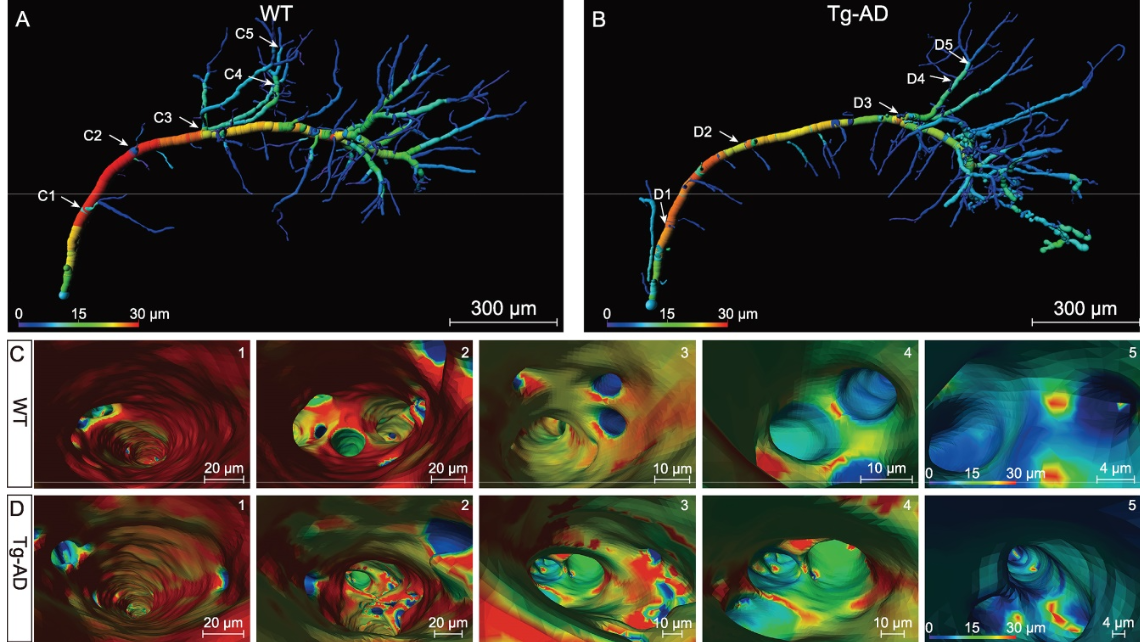
Figure 6.Virtual endoscopic views in the lumen of single hippocampal vessels. (A) and (B) Representative individual hippocampal vessels the same as shown in Fig. 5E and F were used to illustrate the virtual vascular endoscopy for viewing the vessel lumen, with vessel diameters coded by colors and representative viewpoints marked by the white number (C1–5 for WT mice; D1–5 for Tg-AD mice). (1–5) The virtual vascular endoscopic tracking of individual transverse hippocampal vessels in WT mice (C) and Tg-AD mice (D). (1) Initial entry into the vessels. Subsequent images along the tracking pathway are shown in (2)–(5), revealing different endovascular structures between WT and Tg-AD mice. The scale bar in each endoscopic image indicates the magnification of field of view.
Supplementary Movie 1. Three-dimensional visualization and data mining workflow. The workflow includes whole brain reconstruction, extraction of hippocampal region, visual reconstruction of vascular network, visual reconstruction of hippocampal vasculature, sectional view of hippocampal vasculature, extraction and endoscopy of single transverse hippocampal vessel.
Supplementary Movie 2. Comparison of the hippocampal vasculature between WT and Tg-AD mouse from sectional view perpendicular to the longitudinal hippocampal axis.
Supplementary Movie 3. Endoscopic comparison of single hippocampal branch between WT and Tg-AD mouse. The inner micro-structure of vascular lumen was compared between WT and Tg-AD mice by using virtual endoscopy.
Figure 1.High-resolution brain atlas providing a global view of the complex vascular network in a C57BL/6 mouse. (A) Representative coronal section showing the cortex (B), hippocampus (C) and thalamus (D), using the whole-brain Nissl-staining method. Boxed areas in A are shown in B, C and D, revealing somata (black) and vessels (white). The stratum oriens (so), strata pyramidale (sp), strata radiatum (sr), cell layers in the hippocampus. Smaller white circles in sr, nerve processes. (E–H) An image of a 200-μm-thick coronal section of the mouse brain reconstructed using volume rendering, with gray levels color-coded. Boxed areas in the cortex F, hippocampus G and thalamus H are shown at a higher magnification. Yellow/green lines, blood vessels; green dots in sp, somata; radial blue lines in sr, dendrites. (I–L) Maximum intensity projection (MIP) of the 400-μm-thick coronal section adjacent to that shown in E, revealing only blood vessels, with the vascular volumetric density coded in color. Boxed areas of the cortex (J), hippocampus (K) and thalamus (L) are shown at a higher magnification.
Figure 2.Segmented hippocampus for high-resolution vasculature analysis in a C57BL/6 mouse. (A) Lateral view of the 3D-reconstructed whole mouse brain, with a network of pial blood vessels visible on the surface. (B) and (C) Two segmented hippocampi from the mouse brain shown in (A), showing the location in the brain and the anterior view, respectively. (D) and (E) The inner vasculature of the bilateral hippocampi showing equally spaced transverse hippocampal vessels distributed in a rake-like pattern. Individual vessels labeled by different colors. (F) The same hippocampus as that in (E), with vessel diameters coded by colors. (G–I) Images of a hippocampal section perpendicular to the longitudinal axis, showing branches of transverse hippocampal vessels, with the gray level coded by the color in (G) (revealing both vessels, somata and nerve processes in sr). In (H), a selected vessel with the diameter of its main trunk and branches was coded for its diameters in colors (mainly vessels only). (I) Schematic diagram depicting the pattern of the transverse hippocampal vessels. 1: LHV, giving off ITHVs and ETHVs; 2: ITHA, entering the cornu ammonis by the hippocampal sulcus; 3: the branches directly generating from LHV to supply CA1; 4/5: the branches of ITHV respectively supplying CA2 and CA3; 6: ETHV, entering the dentate gyrus by penetrating the fimbriodentate sulcus. In cornu ammonis: so, stratum oriens; sp, stratum pyramidale; sr, stratum radiatum. In dentate gyrus: ml, molecular layer; po, polymorph layer; gcl, granule cell layer. (J) Representative individual hippocampal vessel the same as that shown in (H) was manually segmented, with vessel diameters coded by colors. The transverse hippocampal vessel appears like an arch with microvessels extending from its both dorsal and ventral sides. (1–4) The virtual vascular endoscopic tracking of the individual transverse hippocampal vessel. (1) Initial entry into the vessel. Subsequent images along the tracking pathway are shown in (2)–(4), revealing endovascular structures. The scale bar in each endoscopic image indicates the magnification of field of view.
Figure 3.Comparison of the hippocampal vasculature between WT and Tg-AD mice. (A), (C), (D) and (G) WT group; (B), (E), (F) and (H) Tg-AD group. (A) and (B) Representative coronal view of the vascular network of the right hippocampus and its neighboring brain regions in WT and Tg-AD mice. The brain contours in the top-right corner indicate that the coronal slices between the two dotted lines were reconstructed. Boxed areas in the cortex ((C) and (E)) and hippocampus ((D) and (F)) are shown at a higher magnification. (G) and (H) Representative sectional views of the hippocampal vasculature perpendicular to the longitudinal hippocampal axis. The dotted lines in the top-right corner denote the data displayed in sectional view.
Figure 4.Quantitative comparison of the hippocampal vasculature between WT and Tg-AD mice. (A) and (B) The same sections as shown in Fig. 3G and H are displayed with somata, vessels and nerve processes together to facilitate the demarcation of hippocampal sub-regions. The hippocampal vasculatures were divided into four subareas based on the hippocampal functional partition including the subiculum (Sub), CA1–2, CA3 and molecular layer of the dentate gyrus (DG-ml). The quantitative analyses of the main morphometric parameters were conducted on the basis of these segmented sub-regions. (C–F) Quantitative analysis of the hippocampal vascular network. Columns and boxes in blue are the WT group; columns or boxes in red are the Tg-AD group. (C) Comparison of the mean diameter, volume fraction and length density in the whole hippocampus between WT and Tg-AD mice (unpaired t-test; *P < 0.05; ***P < 0.001; ns, non-significant, P > 0.05; n = 3 mice per group). (D–F) Comparison of the mean diameter, volume fraction and length density in the four segmented sub-regions between the WT and Tg-AD mice (unpaired t-test; *P < 0.05; **P < 0.01; ***P < 0.001; ns, non-significant, P > 0.05; n = 2 sections per mouse for three WT mice and three Tg-AD mice). Error bars in (C) represent s.e.m.; error bars in (D–F) represent the greatest value (above) and lowest value (below).
Figure 5.Analysis of the morphology and architecture in an individual hippocampal vessel. (A), (C), (E) and (G) WT group; (B), (D), (F) and (H) Tg-AD group. (A) and (B) The two middle hippocampal regions were extracted from the WT and Tg-AD mice in similar spatial positions. (C) and (D) Enlarged views of the boxes in (A) and (B) show the distal end of the transverse hippocampal vessels. (E) and (F) The individual hippocampal vessels were segmented manually from (A) and (B) and displayed from a lateral view, with the vessel diameters coded by colors. (G) and (H) The top view of the same vessel as shown in (E) and (F). The divergent angle of the single vascular branch is 38.1° in the WT group and 27.8° in the Tg-AD group. (I) and (J) Columns or lines in blue are the WT group; columns or lines in red are the Tg-AD group. (I) Quantitative comparison of the percentage of the number of vascular segments with different diameters (0–20 μm) between the WT and Tg-AD mice. The 98.3% number of the vascular segments was below 5 μm in the Tg-AD mice and 95.7% in the WT mice (unpaired t-test; *P < 0.05; **P < 0.01; ns, non-significant; P > 0.05; n = 3 mice per group). (J) Quantitative comparison of the average branching angles with different branch levels between the WT and Tg-AD mice. The average branch angles in the Tg-AD mice were significantly decreased beginning at branch level 5 (unpaired t-test; *P < 0.05; **P < 0.01; ***P < 0.001; ns, non-significant, P > 0.05; n = 3 mice per group). Error bars in (I) and (J) represent s.d.
Figure 6.Virtual endoscopic views in the lumen of single hippocampal vessels. (A) and (B) Representative individual hippocampal vessels the same as shown in Fig. 5E and F were used to illustrate the virtual vascular endoscopy for viewing the vessel lumen, with vessel diameters coded by colors and representative viewpoints marked by the white number (C1–5 for WT mice; D1–5 for Tg-AD mice). (1–5) The virtual vascular endoscopic tracking of individual transverse hippocampal vessels in WT mice (C) and Tg-AD mice (D). (1) Initial entry into the vessels. Subsequent images along the tracking pathway are shown in (2)–(5), revealing different endovascular structures between WT and Tg-AD mice. The scale bar in each endoscopic image indicates the magnification of field of view.
Supplementary Movie 1. Three-dimensional visualization and data mining workflow. The workflow includes whole brain reconstruction, extraction of hippocampal region, visual reconstruction of vascular network, visual reconstruction of hippocampal vasculature, sectional view of hippocampal vasculature, extraction and endoscopy of single transverse hippocampal vessel.
Supplementary Movie 2. Comparison of the hippocampal vasculature between WT and Tg-AD mouse from sectional view perpendicular to the longitudinal hippocampal axis.
Supplementary Movie 3. Endoscopic comparison of single hippocampal branch between WT and Tg-AD mouse. The inner micro-structure of vascular lumen was compared between WT and Tg-AD mice by using virtual endoscopy.
2019年12月10日,中科院上海药物研究所蒋华良、高召兵和章海燕三个课题组合作在National Science Review杂志上发表了题为High-resolution mapping of brain vasculature and its impairment in the hippocampus of Alzheimer’s disease mice 的研究论文,报道了首个转基因AD模型小鼠的高精度全脑血管网络图谱,结果显示AD模型小鼠脑内特别是海马区的血管系统显著受损,提示血管损伤在AD病理过程中的2019年12月10日,中科院上海药物研究所在National Science Review杂志上发表研究论文,基于MOST技术,报道了首个转基因AD模型小鼠的高精度全脑血管网络图谱。重要性之前远未充分认识,为发展高效AD治疗药物及干预手段指出了新的方向。
参考文献
参考文献[1]: Xiaochuan Zhang, et al., High-resolution mapping of brain vasculature and its impairment in the hippocampus of Alzheimer's disease mice, National Science Review, nwz124, Published: 28 August 2019