

一微米体素分辨率下全脑细胞和毛细血管的同步可视化和分析
染色方法:
尼氏染色
标记方法:
Nissl染色
包埋方法:
树脂包埋
成像平台:
BioMapping 1000

cover
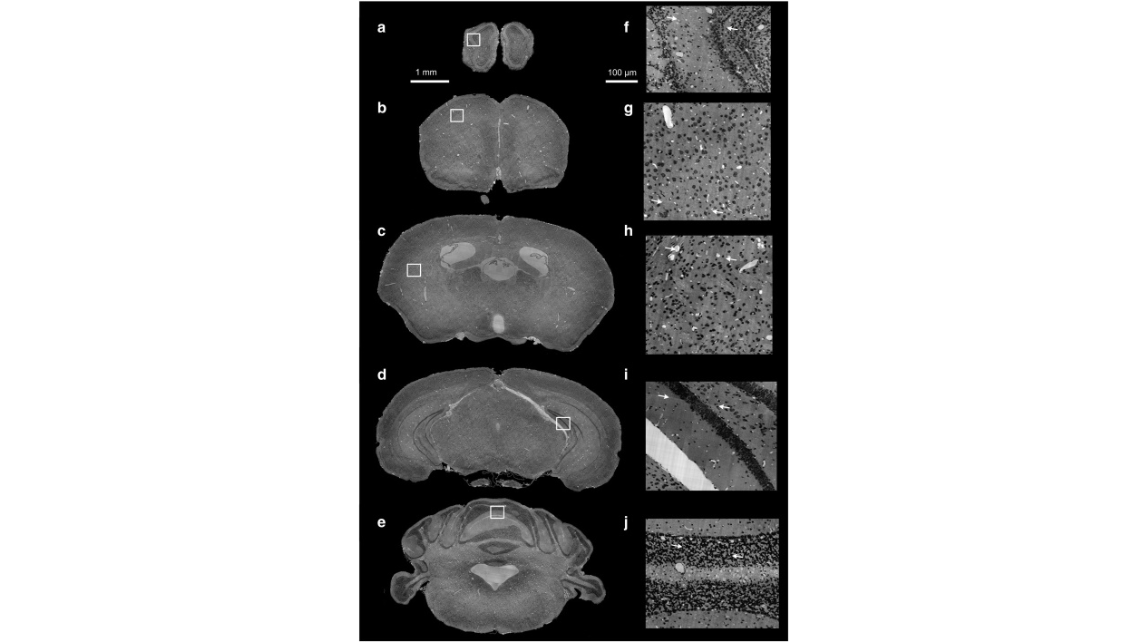
Fig. 1. Coronal sections of a preprocessed high-resolution whole mouse brain dataset. (a–e) All the coronal sections (thickness: 1 μm) were evenly spaced at a constant distance of 2 mm from anterior to posterior. (f–j) Local enlarged views in (a–e) illustrate the cellular and vascular architecture of the olfactory bulb, primary motor cortex, striatum, hippocampus, and cerebellum. The white arrows in (f, h–j) indicate the stitched sectioning boundaries, and the morphology of the cells and blood vessels were well maintained.
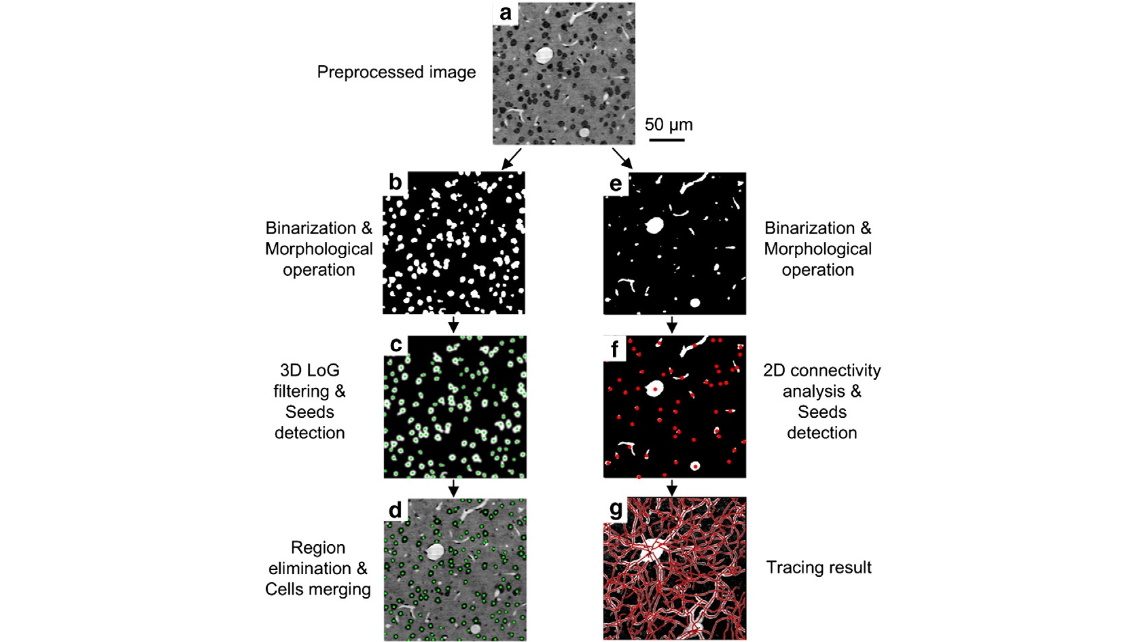
Fig. 2. Vectorization of cells and blood vessels. (a) The preprocessed image distinguishes cross-sections of cells (black) and blood vessels (white) clearly and simultaneously. (b) The binary image shows the cross-sections of cells. (c) The response of the 3D multiscale Laplacian of Gaussian filter. The green points indicate local maximum pixels that were characterized as can- didate seeds. (d) The green points and boundaries indicate the detected cellular centroids after centroid merging. (e) The binary image shows cross sections of blood vessels. (f) The red points indicate the initial seeds of vessel tracing, which were located using a connectivity analysis of the binarized image. (g) The traced red centerlines were superimposed onto maximum intensity projections for qualitative assessment (thickness: 50 μm).
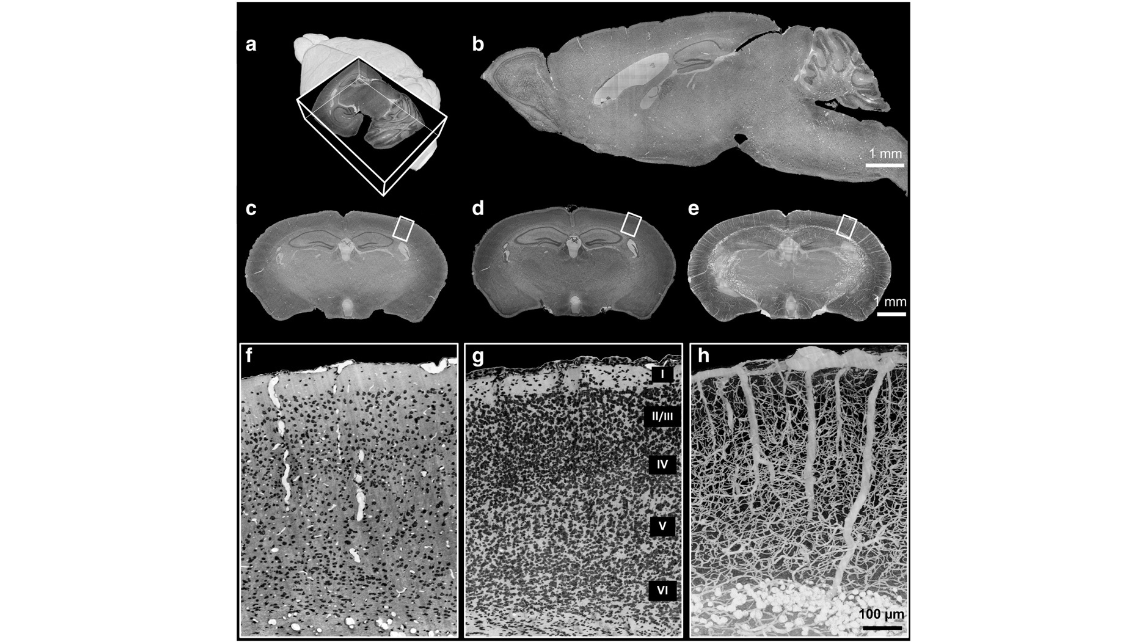
Fig. 3. 3D dataset of a whole mouse brain used to simultaneously visualize the cells and blood vessels. (a) 3D reconstruction of the whole mouse brain with a corner-cut view. (b, c) Sagittal and coronal sections in (a) (thickness: 1 μm) show the inner structures of the whole mouse brain. Note that the background intensity is uniform. (d) Minimum intensity projection of (c) (thick- ness: 30 μm, posterior direction) shows the cytoarchitecture. (e) Maximum intensity projection of (c) (thickness: 200 μm, posterior direction) shows vascular architecture. (f) Enlarged view of the cortical region indicated by the white box in (c) shows simultaneous cross-sections of cells (black) and blood vessels (white). (g) The enlarged view of the cortical region indicated by the white box in (d) shows the laminar cytoarchitecture in the neocortex. Layers I to VI can be clearly distinguished. (h) Enlarged view of the cortical region indicated by the white box in (e) shows the vascular architecture, including capillaries, in the neocortex. The diameters of the large penetrating vessels are approximately 23 μm and the diameter of small capillaries are less than 3 μm. Note that the capillaries are interconnected with few gaps, suggesting complete labeling of the vascular network.

Fig. 4. Reconstruction and colocalization of vectorized cells and blood vessels in M1. (a) 3D reconstruction of the cytoarchitecture in M1. The green points represent detected cellular cen- troids. (b) The surface rendering of the vasculature shows how some large vessels penetrate into the cerebral cortex. The curved tubes represent the traced blood vessels, and the diameters of the blood vessels are encoded as indicated by the color bar. The white arrow indicates a large penetrating vessel, the diameter of which exceeds 60 μm. The pial vascular network was manual labeled and rendered to give an anatomical context. The size of the gray bounding box is 600 μm × 600 μm × 920 μm. (c) An enlarged view of the white box in (a, b) shows colocalization of the cells (green) and blood vessels (red). The size of the white bounding box is 200 μm × 200 μm × 100 μm.

Fig. 5. Laminar profiles of cellular and vascular distribution in M1, PMBSF and V1 of a mouse brain. The results show the laminar variation in cell number density (a), the distance from the cells to the nearest microvessels (b), the vascular length density (c) and the microvascular fractional volume (d) along the axial direction. Layers I to VI were approximately localized ac- cording to the cell number density profiles shown in (a). The red, green and blue curves indicate M1, PMBSF and V1, respectively, and the transparent regions show the standard deviations.
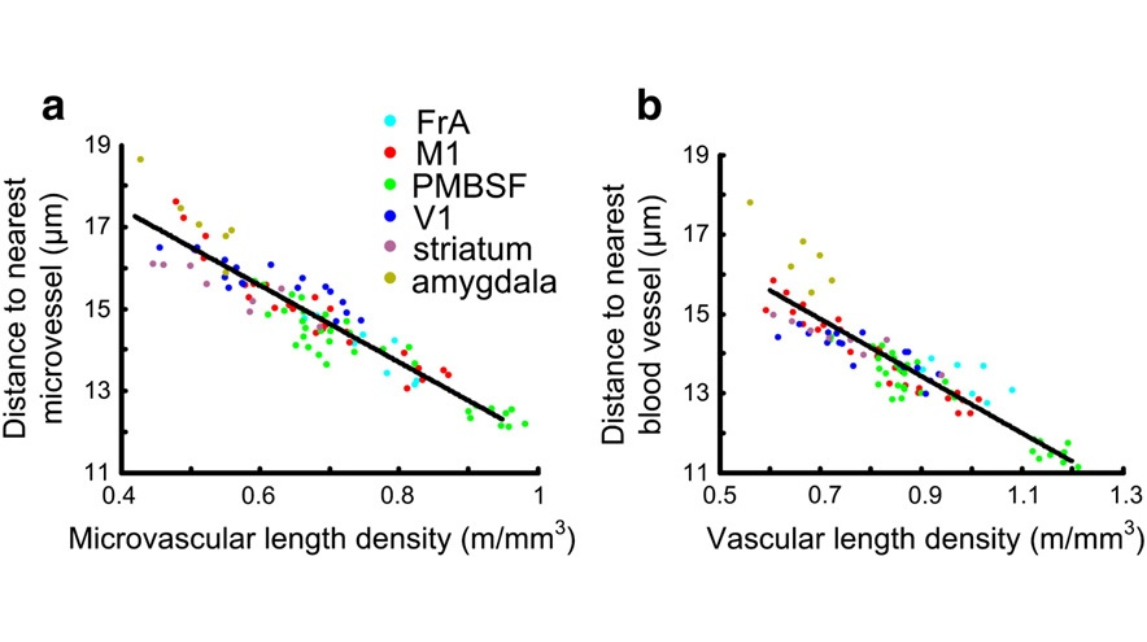
Fig. 6. The distances from cells to the nearest microvessel are linearly correlated with microvascular length density (a). Eliminating the influence of vascular diameter threshold, the distances from thecells to the nearestblood vessel arealsolinearly correlatedwith vascularlength density (b). Thebluishgreen,red, green,blue, lilac,and yellowish green dots indicate FrA, M1, PMBSF, V1, striatum, and amygdala respectively.
Video 1. Fly-through of a 3D dataset of the whole mouse brain. The 3D reconstruction shows the completeness of the dataset with no data loss. The coronal and sagittal sections show the brain wide uniform background, and the inner brain structures can be identified
Video 2. 3D reconstruction and qualitative assessment of the vectorized cells and blood vessels in M1. The color coded curved tubes represent the blood vessels, and the green spheres represent cells. The spheres and tubes were superimposed upon the volume rendering of preprocessed image stacks in a white bounding box
cover
Fig. 1. Coronal sections of a preprocessed high-resolution whole mouse brain dataset. (a–e) All the coronal sections (thickness: 1 μm) were evenly spaced at a constant distance of 2 mm from anterior to posterior. (f–j) Local enlarged views in (a–e) illustrate the cellular and vascular architecture of the olfactory bulb, primary motor cortex, striatum, hippocampus, and cerebellum. The white arrows in (f, h–j) indicate the stitched sectioning boundaries, and the morphology of the cells and blood vessels were well maintained.
Fig. 2. Vectorization of cells and blood vessels. (a) The preprocessed image distinguishes cross-sections of cells (black) and blood vessels (white) clearly and simultaneously. (b) The binary image shows the cross-sections of cells. (c) The response of the 3D multiscale Laplacian of Gaussian filter. The green points indicate local maximum pixels that were characterized as can- didate seeds. (d) The green points and boundaries indicate the detected cellular centroids after centroid merging. (e) The binary image shows cross sections of blood vessels. (f) The red points indicate the initial seeds of vessel tracing, which were located using a connectivity analysis of the binarized image. (g) The traced red centerlines were superimposed onto maximum intensity projections for qualitative assessment (thickness: 50 μm).
Fig. 3. 3D dataset of a whole mouse brain used to simultaneously visualize the cells and blood vessels. (a) 3D reconstruction of the whole mouse brain with a corner-cut view. (b, c) Sagittal and coronal sections in (a) (thickness: 1 μm) show the inner structures of the whole mouse brain. Note that the background intensity is uniform. (d) Minimum intensity projection of (c) (thick- ness: 30 μm, posterior direction) shows the cytoarchitecture. (e) Maximum intensity projection of (c) (thickness: 200 μm, posterior direction) shows vascular architecture. (f) Enlarged view of the cortical region indicated by the white box in (c) shows simultaneous cross-sections of cells (black) and blood vessels (white). (g) The enlarged view of the cortical region indicated by the white box in (d) shows the laminar cytoarchitecture in the neocortex. Layers I to VI can be clearly distinguished. (h) Enlarged view of the cortical region indicated by the white box in (e) shows the vascular architecture, including capillaries, in the neocortex. The diameters of the large penetrating vessels are approximately 23 μm and the diameter of small capillaries are less than 3 μm. Note that the capillaries are interconnected with few gaps, suggesting complete labeling of the vascular network.
Fig. 4. Reconstruction and colocalization of vectorized cells and blood vessels in M1. (a) 3D reconstruction of the cytoarchitecture in M1. The green points represent detected cellular cen- troids. (b) The surface rendering of the vasculature shows how some large vessels penetrate into the cerebral cortex. The curved tubes represent the traced blood vessels, and the diameters of the blood vessels are encoded as indicated by the color bar. The white arrow indicates a large penetrating vessel, the diameter of which exceeds 60 μm. The pial vascular network was manual labeled and rendered to give an anatomical context. The size of the gray bounding box is 600 μm × 600 μm × 920 μm. (c) An enlarged view of the white box in (a, b) shows colocalization of the cells (green) and blood vessels (red). The size of the white bounding box is 200 μm × 200 μm × 100 μm.
Fig. 5. Laminar profiles of cellular and vascular distribution in M1, PMBSF and V1 of a mouse brain. The results show the laminar variation in cell number density (a), the distance from the cells to the nearest microvessels (b), the vascular length density (c) and the microvascular fractional volume (d) along the axial direction. Layers I to VI were approximately localized ac- cording to the cell number density profiles shown in (a). The red, green and blue curves indicate M1, PMBSF and V1, respectively, and the transparent regions show the standard deviations.
Fig. 6. The distances from cells to the nearest microvessel are linearly correlated with microvascular length density (a). Eliminating the influence of vascular diameter threshold, the distances from thecells to the nearestblood vessel arealsolinearly correlatedwith vascularlength density (b). Thebluishgreen,red, green,blue, lilac,and yellowish green dots indicate FrA, M1, PMBSF, V1, striatum, and amygdala respectively.
Video 1. Fly-through of a 3D dataset of the whole mouse brain. The 3D reconstruction shows the completeness of the dataset with no data loss. The coronal and sagittal sections show the brain wide uniform background, and the inner brain structures can be identified
Video 2. 3D reconstruction and qualitative assessment of the vectorized cells and blood vessels in M1. The color coded curved tubes represent the blood vessels, and the green spheres represent cells. The spheres and tubes were superimposed upon the volume rendering of preprocessed image stacks in a white bounding box
2014年2月15日,华中科技大学武汉光电国家研究中心骆清铭教授课题组,展示了全脑细胞和血管的3D可视化和全脑定量方案。利用MOST技术 ,以1微米体素分辨率同时成像了包括毛细血管在内的单个细胞和血管前所未有的细节的小鼠整个大脑的3D 数据集。文章发表在《神经影像》杂志上。
参考文献
参考文献[1]:Wu J, He Y, Yang Z, Guo C, Luo Q, Zhou W, Chen S, Li A, Xiong B, Jiang T, Gong H. 3D BrainCV: simultaneous visualization and analysis of cells and capillaries in a whole mouse brain with one-micron voxel resolution. Neuroimage (2014);87:199-208.