

利用MOST技术获取高分辨率小鼠全脑数据集
染色方法:
高尔基染色
标记方法:
Golgi染色
包埋方法:
树脂包埋
成像平台:
BioMapping 1000
cover
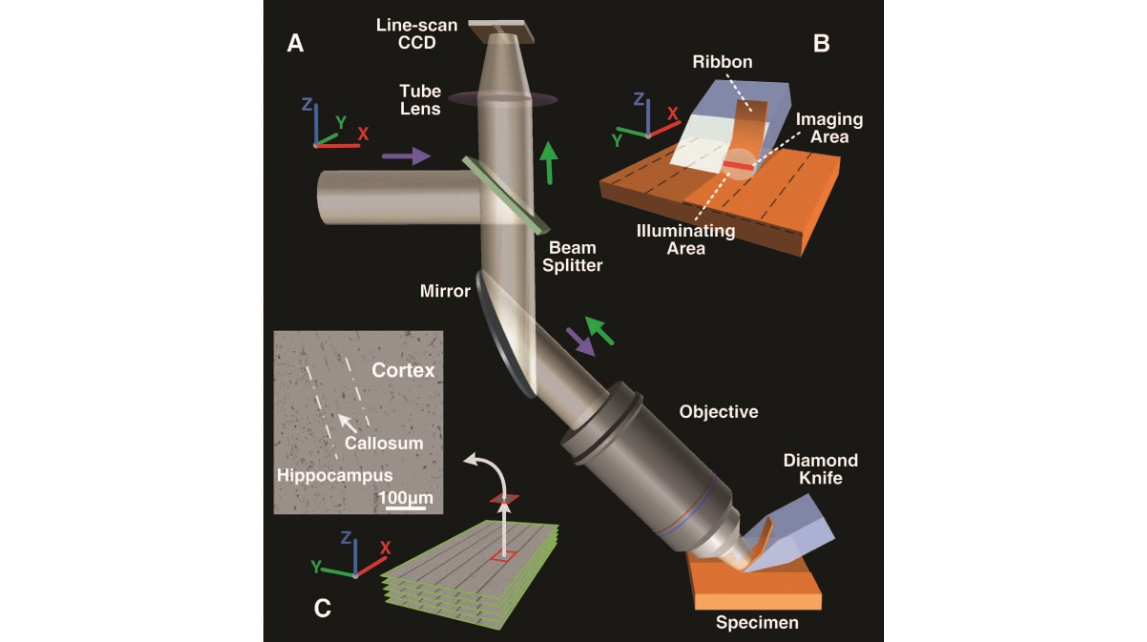
Fig. 1. (A) Schematic representation of the MOST system. Thespecimenismountedinachamber,themotionofwhichis controlled by a series of mechanical translation stages that can move in three directions (the chamber and stages are not shown). Slicing is performed by moving the specimen along the x axis to generate ribbons, and each ribbon is simulta- neously imaged. The illuminating beam passes through the beam splitter, mirror, and objective and irradiates the ribbon. After it passes through the mirror, beam splitter, and tube lens, the imaging beam collected by the objective is then recorded by a line-scan CCD. (B) Schematic representation of slicing. The slicing produces ribbons that glide forward along the knife face. The illuminating and imaging areas are indi- cated by a circle and a red line, respectively. To expand the detection range, we performed slicing with a lateral and an axial scan (15). (C) An image stack acquired using MOST. The stack is composed of many subimages.The subimages aligned along the x axis were produced from a ribbon. These image sequencesreconstitutetheentirecrosssectionofthespecimen along the y axis. A subimage of the cortex, hippocampus, and corpus callosum is also indicated.

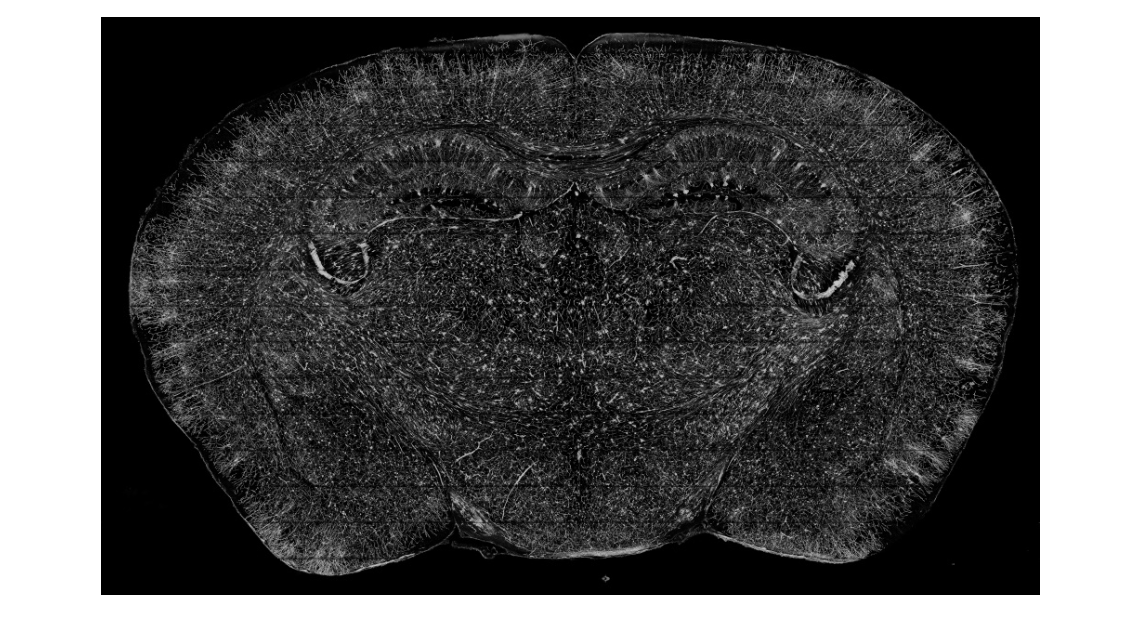
Fig. 2. (A) Locations of images shown in (B) to (L), spaced 1 mm apart, from the olfactory bulb to the cerebel- lum. (B to L) A series of im- ages reconstructed from a stack of 100 coronal sections (total thickness of 0.1 mm). Thehorizontalstripes,caused byrefractiveindex mismatch between specimen and am- bient medium, lead to little informationloss.Therawdata fromMOSTare8-bitgrayscale images, and the resulting re- construction uses a green pseudocolor to enhance their visible effects; dorsal-ventral and left-right axes are in- dicated at lower left. The dashedboxin(H)isdescribed in Fig. 4B.
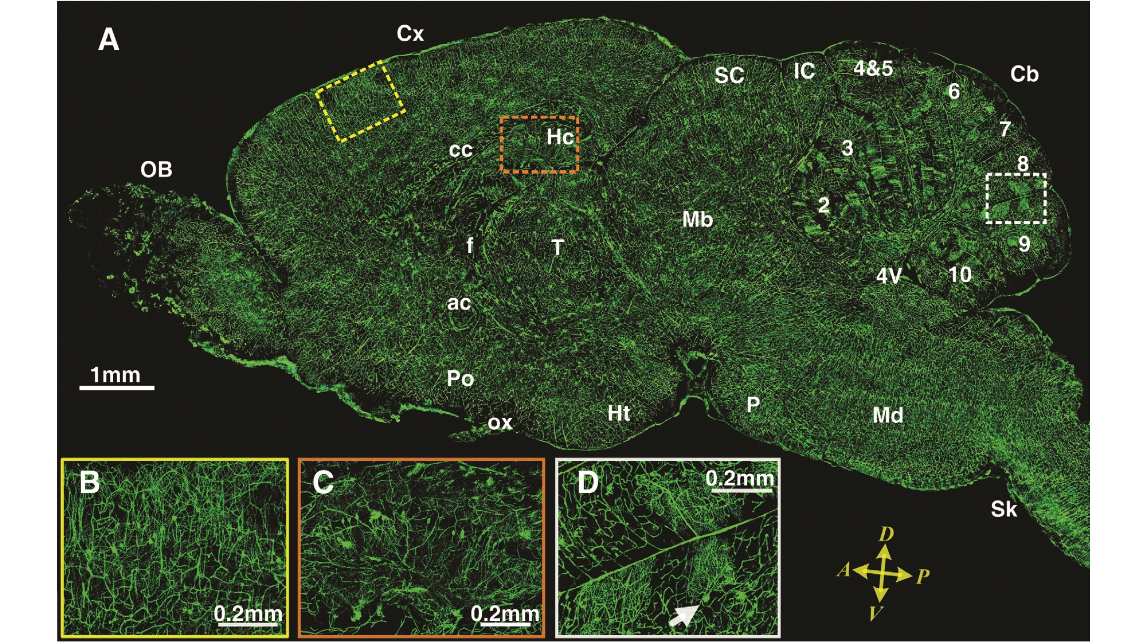
Fig. 3. (A)Asagittalim- age reconstructed from a stack of 100 virtual sagit- tal sections (total thick- ness of 0.1 mm). These sectionsweretransformed from the original coronal sections. The sagittal image was located in the right hemisphere about 0.4mmlateraltothemid- dle. Dorsal-ventral and anterior-posterior axes are indicated. Almost all major regions of the brain can be seen inthis image:OB,olfactorybulb; Cx,cerebralcortex;Hc,hip- pocampus; f, fornix; ac, anterior commissure; T, thalamus;Cb,cerebellum; Mb, midbrain; P, pons; Md, medulla; cc, corpus callosum; SC, superior colliculus;IC, inferior col- liculus; Ht, hypothala- mus; Po, preoptic area; ox, optic chiasm; 4V, 4th ventricle; arabic numerals 2to 10, nine lobules of the cerebellum;Sk,spinal cord. Thethreeregionsinsidethedashedrectanglesarethepositionsof(B),(C),and(D), fromlefttoright.(BtoD)Thecerebralcortex(B),hippocampus(C),andcerebellum (D).Inthereconstructionofsagittalimages,nodislocationwasobservedalongthe dorsal-ventral axis; that is, the coronal sections are inherently aligned along the anterior-posterior axis. Arrow in (D) indicates the image described in Fig. 4D.
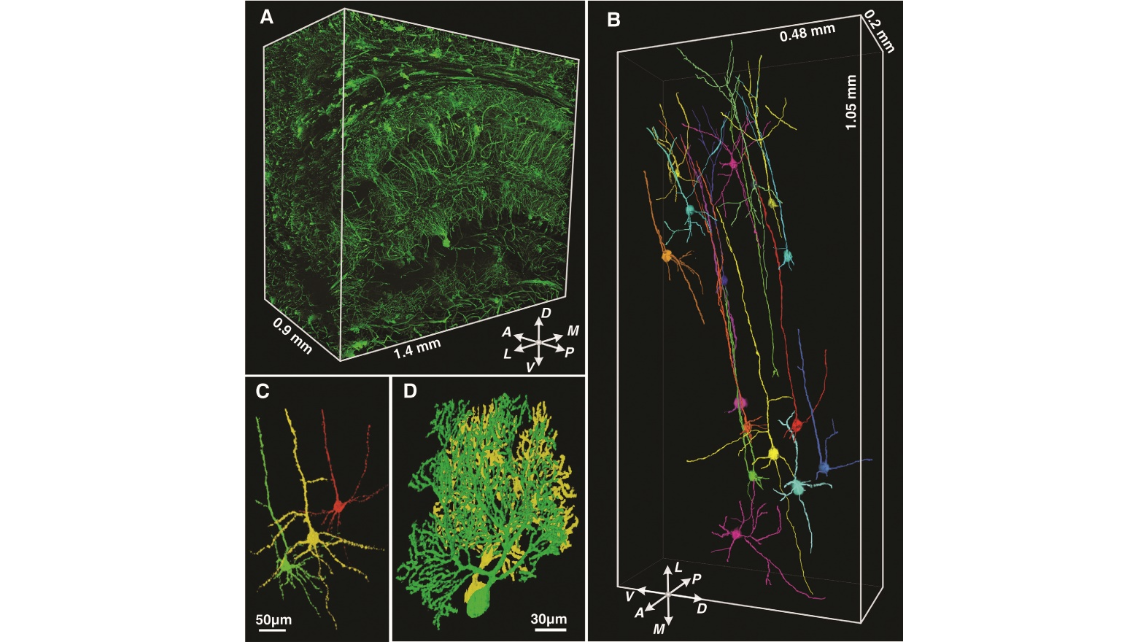
Fig. 4. (A) A large volumetric reconstruction of a partial hippocampus of the mouse brain. The cube volume is 1.4 mm by 1.5 mm by 0.9 mm. The multi- layered structure of the hippocampus and a large number of transverse fibers of the corpus callosum are clearly visible. Dorsal-ventral, anterior-posterior, and left-medial axes are indicated. (B) We traced the neurites of 17 neurons in the ectorhinal cortex, indicated by a dashed box in Fig. 2H. (C) Three-dimensional reconstruction of three neighboring pyramidal cells in layer5 of theectorhinalcortexasin(B).Thesethreecells aredistinguished by different colors; other cells, neurites, and blood vessels that densely cover the three cells are not shown. (D) Three-dimensional reconstruction of a pair of neighboring Purkinje cells in the ninth lobule of the cerebellum. The Purkinje cell in green can also be seen in Fig. 3D, indicated by an arrow.
Movie S4: Rotation animation of two Purkinje cells in 3D
Movie S5:Rotation animation of the neurites of ectorhinal cortex in 3D
cover
Fig. 1. (A) Schematic representation of the MOST system. Thespecimenismountedinachamber,themotionofwhichis controlled by a series of mechanical translation stages that can move in three directions (the chamber and stages are not shown). Slicing is performed by moving the specimen along the x axis to generate ribbons, and each ribbon is simulta- neously imaged. The illuminating beam passes through the beam splitter, mirror, and objective and irradiates the ribbon. After it passes through the mirror, beam splitter, and tube lens, the imaging beam collected by the objective is then recorded by a line-scan CCD. (B) Schematic representation of slicing. The slicing produces ribbons that glide forward along the knife face. The illuminating and imaging areas are indi- cated by a circle and a red line, respectively. To expand the detection range, we performed slicing with a lateral and an axial scan (15). (C) An image stack acquired using MOST. The stack is composed of many subimages.The subimages aligned along the x axis were produced from a ribbon. These image sequencesreconstitutetheentirecrosssectionofthespecimen along the y axis. A subimage of the cortex, hippocampus, and corpus callosum is also indicated.
Fig. 2. (A) Locations of images shown in (B) to (L), spaced 1 mm apart, from the olfactory bulb to the cerebel- lum. (B to L) A series of im- ages reconstructed from a stack of 100 coronal sections (total thickness of 0.1 mm). Thehorizontalstripes,caused byrefractiveindex mismatch between specimen and am- bient medium, lead to little informationloss.Therawdata fromMOSTare8-bitgrayscale images, and the resulting re- construction uses a green pseudocolor to enhance their visible effects; dorsal-ventral and left-right axes are in- dicated at lower left. The dashedboxin(H)isdescribed in Fig. 4B.
Fig. 3. (A)Asagittalim- age reconstructed from a stack of 100 virtual sagit- tal sections (total thick- ness of 0.1 mm). These sectionsweretransformed from the original coronal sections. The sagittal image was located in the right hemisphere about 0.4mmlateraltothemid- dle. Dorsal-ventral and anterior-posterior axes are indicated. Almost all major regions of the brain can be seen inthis image:OB,olfactorybulb; Cx,cerebralcortex;Hc,hip- pocampus; f, fornix; ac, anterior commissure; T, thalamus;Cb,cerebellum; Mb, midbrain; P, pons; Md, medulla; cc, corpus callosum; SC, superior colliculus;IC, inferior col- liculus; Ht, hypothala- mus; Po, preoptic area; ox, optic chiasm; 4V, 4th ventricle; arabic numerals 2to 10, nine lobules of the cerebellum;Sk,spinal cord. Thethreeregionsinsidethedashedrectanglesarethepositionsof(B),(C),and(D), fromlefttoright.(BtoD)Thecerebralcortex(B),hippocampus(C),andcerebellum (D).Inthereconstructionofsagittalimages,nodislocationwasobservedalongthe dorsal-ventral axis; that is, the coronal sections are inherently aligned along the anterior-posterior axis. Arrow in (D) indicates the image described in Fig. 4D.
Fig. 4. (A) A large volumetric reconstruction of a partial hippocampus of the mouse brain. The cube volume is 1.4 mm by 1.5 mm by 0.9 mm. The multi- layered structure of the hippocampus and a large number of transverse fibers of the corpus callosum are clearly visible. Dorsal-ventral, anterior-posterior, and left-medial axes are indicated. (B) We traced the neurites of 17 neurons in the ectorhinal cortex, indicated by a dashed box in Fig. 2H. (C) Three-dimensional reconstruction of three neighboring pyramidal cells in layer5 of theectorhinalcortexasin(B).Thesethreecells aredistinguished by different colors; other cells, neurites, and blood vessels that densely cover the three cells are not shown. (D) Three-dimensional reconstruction of a pair of neighboring Purkinje cells in the ninth lobule of the cerebellum. The Purkinje cell in green can also be seen in Fig. 3D, indicated by an arrow.
Movie S4: Rotation animation of two Purkinje cells in 3D
Movie S5:Rotation animation of the neurites of ectorhinal cortex in 3D
2010年11月4日,华中科技大学武汉光电国家研究中心骆清铭教授课题组搭建了显微光学切片断层扫描(MOST)系统,展示了目前最大的也是分辨率最高的鼠脑突起结构数据集,文章发表在《科学》杂志。
参考文献
参考文献[1]:Li A, Gong H, Zhang B, Wang Q, Yan C, Wu J, Liu Q, Zeng S, Luo Q. Micro-optical sectioning tomography to obtain a high-resolution atlas of the mouse brain. Science (2010); 330(6009):1404-8.