

小鼠内侧脑前额叶外皮 gaba 能中间神经元远程输入的全脑图谱
染色方法:
病毒示踪标记
标记方法:
EGFP、EYFP、 ERFP、 mCherry、 Tdtomato
包埋方法:
树脂包埋
成像平台:
BioMapping 5000
cover
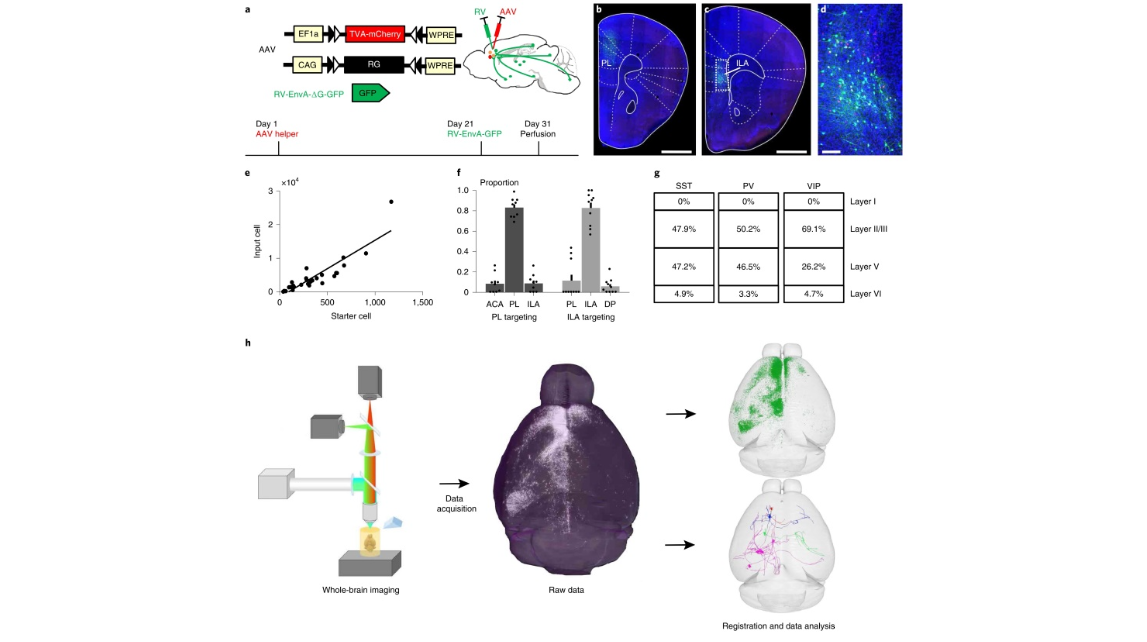
Fig. 1 | Characterization of monosynaptic inputs to three types of interneurons in different subregions of the mPFC. a, AAV helper virus and genetically modified rabies virus pseudotyped with EnvA. The RG gene is replaced by EGFP. The experimental strategy and time line are shown on the right and below. b,c, Characterization of the injection site at the PL (b) and ILA areas (c). d, Enlarged image of boxed area in c showing the starter cells (yellow) and local input cells (green). e, Relationship between starter cell and long-range input cells; 28 mice were used for the analysis. Units indicate numbers of neurons. f, Distribution of the starter cells in each cortical area when targeting the PL or ILA areas; 9 mice with PL targeting and 10 mice with ILA targeting were used for the analysis. g, Layer distribution of starter cells. SST+, n = 12 mice; PV+, n = 8 mice; VIP+, n = 8 mice. h, Main steps of data generation and processing. The virus-labeled samples were imaged using a whole-brain imaging system, and the raw data were analyzed and registered to the Allen CCF v.3.0. Scale bars, b,c, 1 mm; d, 100 µm. ACA, anterior cingulate area; DP, dorsal peduncular area.
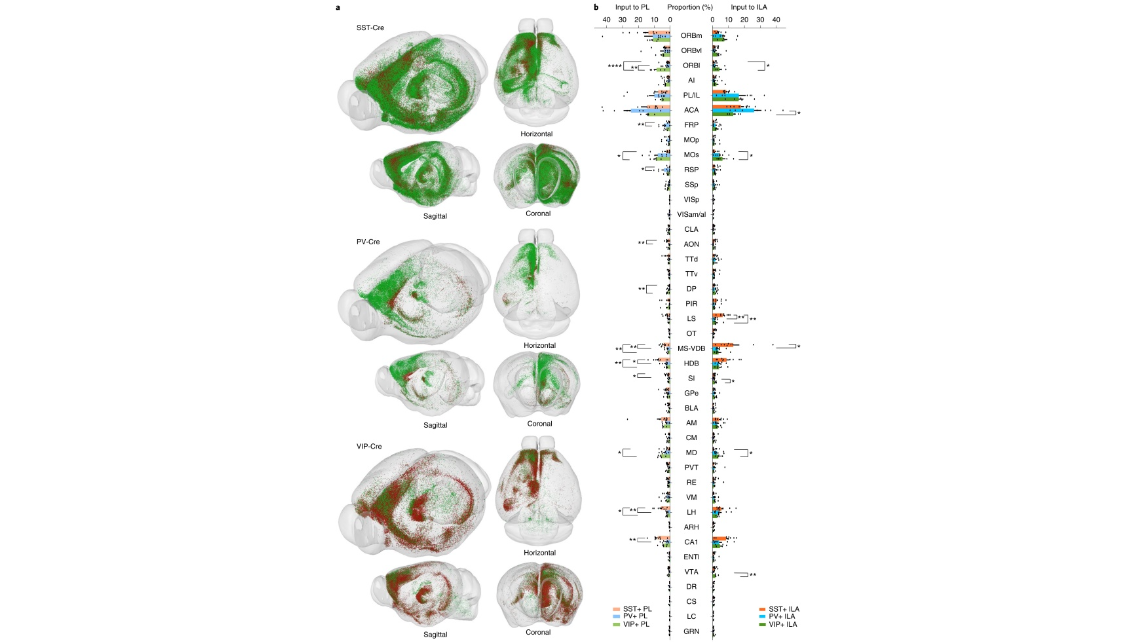
Fig. 2 | Visualization of the whole-brain input neurons to three types of interneurons in two subregions of the mPFC and quantification of the input neurons in individual brain regions. a, AAV helper virus was injected into the PL and ILA areas, RV-EnvA-GFP (green dots) was injected into the PL, and RV-EnvA-DsRed (red dots) was injected into the ILA area. The somas of RV-labeled neurons were extracted by NeuroGPS and registered to the Allen CCF v.3.0. b. Proportions of long-range inputs to PV+, SST+ and VIP+ neurons in two subregions of the mPFC across individual brain areas. One-way ANODRVA followed by Tukey’s post hoc tests, *P < 0.05, **P < 0.01, ****P < 0.0001; SST+, n = 18 mice; PV+, n = 14 mice; VIP+ , n = 10 mice; for detailed P values, see text. Data shown as mean ± s.e.m. See the details in Supplementary Table 4. A list of abbreviations is provided in Supplementary Table 15.
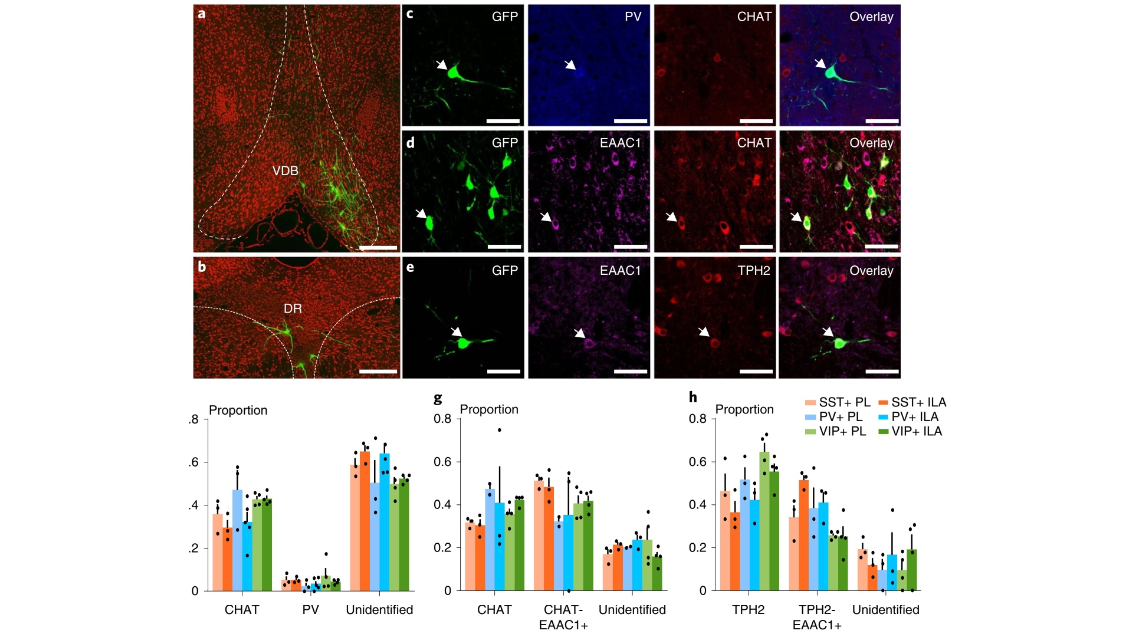
Fig. 3 | Modulation of GABAergic neurons in the mPFC by multiple neurotransmitters. a, GABAergic neurons in the mPFC receive direct inputs from the basal forebrain (SST+, n = 18 mice; PV+, n = 14 mice; VIP+, n = 10 mice). b, GABAergic neurons in the mPFC receive direct inputs from raphe nuclei (SST+, n = 18 mice; PV+, n = 14 mice; VIP+, n = 10 mice). c,d, Both PV+ neurons and cholinergic neurons in the basal forebrain form monosynaptic inputs to GABAergic neurons in the mPFC, and most of the cholinergic neurons also express EAAC1 (PV and CHAT double immunostaining, SST+, n = 6 mice; PV+, n = 8 mice; VIP+, n = 8 mice; CHAT and EAAC1 double immunostaining, SST+, n = 6 mice; PV+, n = 5 mice; VIP+, n = 8 mice). e, Serotonergic neurons in raphe nuclei directly input to GABAergic neurons in the medial cortex, and most of them express EAAC1 (SST+, n = 6 mice; PV+, n = 6 mice; VIP+, n = 8 mice). f, Quantification of EGFP-labeled neurons that are cholinergic and PV+ (SST+, n = 6 mice; PV+, n = 8 mice; VIP+, n = 8 mice, data shown as mean ± s.e.m.). g, Quantification of EGFP-labeled neurons that are cholinergic and EAAC1+ (SST+, n = 6 mice; PV+, n = 5 mice; VIP+, n = 8 mice, data shown as mean ± s.e.m.). h, Quantification of EGFP-labeled neurons that are serotonergic and EAAC1+ (SST+, n = 6 mice; PV+, n = 6 mice; VIP+, n = 8 mice, data shown as mean ± s.e.m.). Scale bars, a,b, 200 µm; c–e, 50 µm.
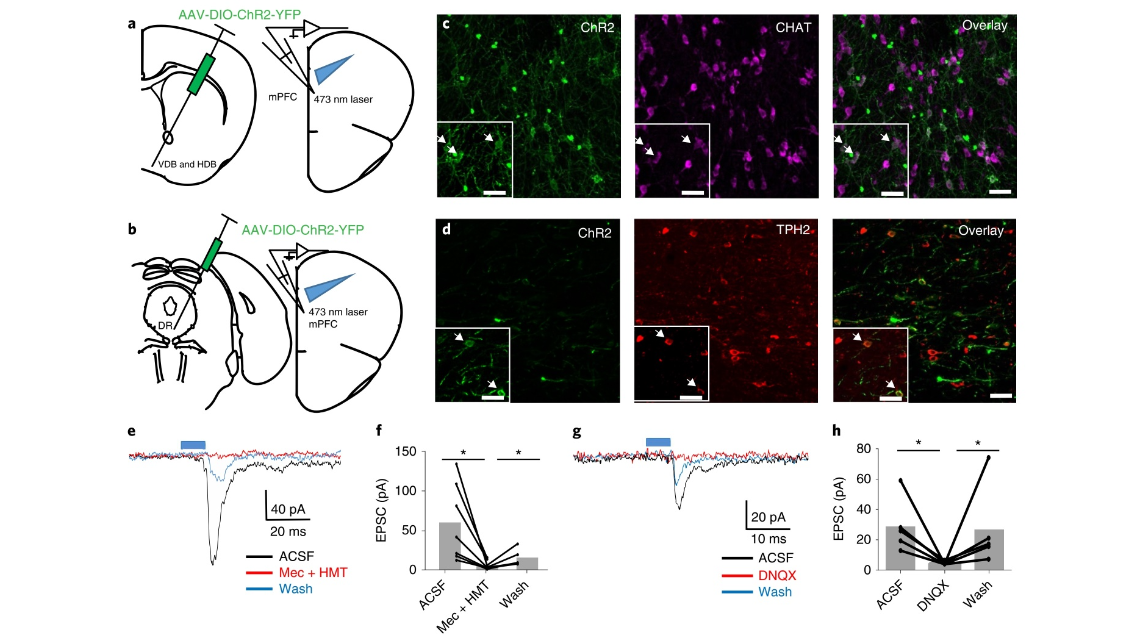
Fig. 4 | Characterization of the functional inputs from cholinergic neurons in basal forebrain and serotonin neurons in raphe nuclei to GABAergic neurons in the mPFC. a, Experimental designs for recordings of GABAergic neurons in the mPFC following AAV-DIO-ChR2 injections in VDB and HDB of chatCre:GAD67-GFP mice. b, Experimental designs for recordings of GABAergic neurons in the mPFC following AAV-DIO-ChR2 injections in raphe nuclei of sert-Cre:GAD67-GFP mice. c,d, Immunostaining against CHAT and TPH2, respectively, to validate the specificity of ChR2 expression. Enlarged images are given in the boxes in c and d (chat-Cre:GAD67-GFP, n = 6 mice; sert-Cre:GAD67-GFP, n = 6 mice). e, Example traces of GABAergic neuron recordings with paired-pulse laser-evoked stimulation of cholinergic terminals in the mPFC. The EPSCs can be blocked by Mec + MHT (7 of 34 cells in 6 mice). f, Effects of Mec and HMT on EPSCs evoked by blue-light stimulation of chat + fibers when recording GABAergic neurons in the mPFC (7 cells in 6 mice, two-tailed paired t-test, *P < 0.05, aCSF versus Mec + HMT, P = 0.014, Mec + HMT versus Wash, P = 0.038). g, Example traces of GABAergic neuron recordings with paired-pulse laser-evoked stimulation of cholinergic terminals or serotoninergic terminals in the mPFC. The EPSCs can be blocked by DNQX (2 of 34 cells in 6 Chat-Cre:GAD67-GFP mice, 3 of 63 cells in 6 sert-Cre:GAD67-GFP mice). h, Effect of DNQX on EPSCs evoked by blue-light stimulation of chat fibers or 5-hydroxytryptamine fibers when recording GABAergic neurons in the mPFC (5 cells in 6 mice). Scale bars, c,d, 50 µm (two-tailed paired t-test, *P < 0.05, ACSF versus DNQX, P = 0.038, DNQX versus Wash, P = 0.019). aCSF, artificial cerebrospinal fluid; wash, antagonists are washed out with aCSF.
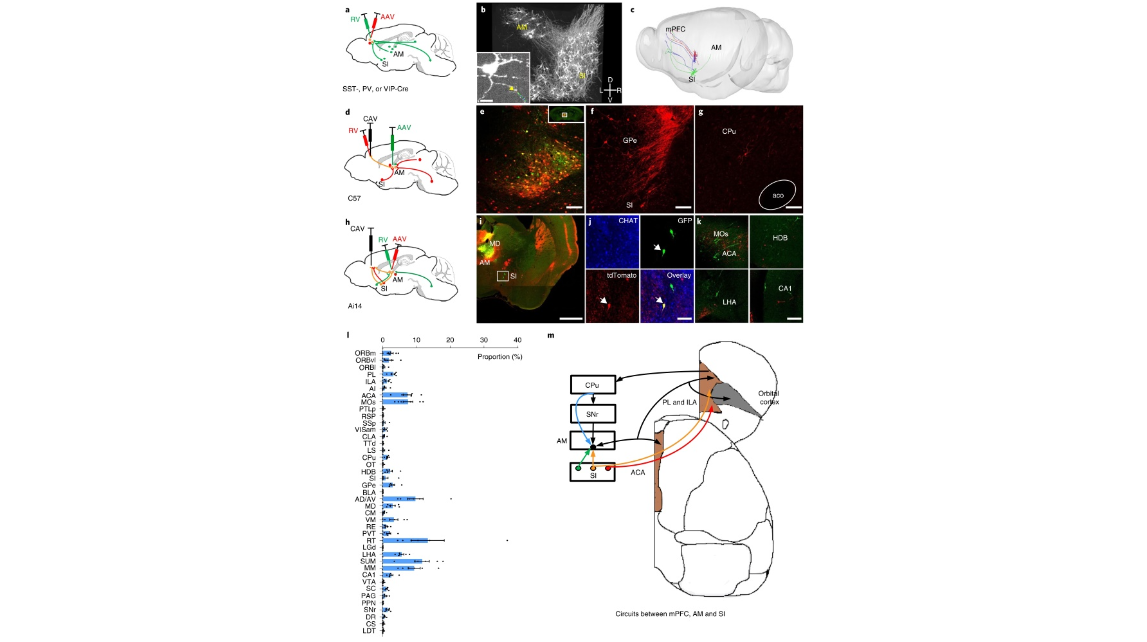
Fig. 5 | A neural circuit among mPFC, Si and AM. a, Labeling direct input neurons in AM and SI to different GABAergic neurons in the mPFC with monosynaptic RV tracing. b, 3D view of the RV-labeled somas and axons in SI and AM. The boxed image in b shows a neuron in the AM and axons from SI (SST+, n = 18 mice; PV+, n = 14 mice; VIP+, n = 10 mice). The arrowhead indicates the axon terminals. c, The morphology of neurons in SI that innervated mPFC and AM (n = 2 mice). d, Labeling direct inputs to neurons in AM that project to the mPFC using the cTRIO strategy. e, The starter cells (yellow) and local input neurons (red) at the RV injection site; n = 6 mice. f,g, Neurons in SI and CPu can directly project to neurons in AM that project to the mPFC, n = 6 mice. h, Strategy for labeling neurons that directly project to the mPFC and indirectly project to the mPFC through AM. i,j, Neurons in SI can directly project to the mPFC and send collateral projections to neurons in AM that project to the mPFC, and a non-cholinergic neuron labeled by GFP and tdTomato is shown in j (n = 4 mice). k, Within MOs, HDB, LHA and CA1, distinct neurons project to the mPFC and AM (MOs, HDB, n = 4 mice; LHA, CA1, n = 3 mice). l, Quantification of inputs to neurons in AM that project to the mPFC, n = 6 mice, data shown as mean ± s.e.m. m, An updated circuitry model among the mPFC, SI and AM. The conventional circuits are shown in black and the circuits revealed in this study are shown in other colors. Scale bar, boxed image in b, 20 µm; i, 1 mm; e–g,k, 100 µm; j, 50 µm. CA1, CA1 area of the hippocampus; CPu, caudoputamen; MO, motor area; LHA, lateral hypothalamic area; L, left; R, right; D, dorsal; V, ventral.

Fig. 6 | Distribution of input neurons in the neocortex to three types of GABAergic neurons in the mPFC. a, The distribution of cortical input neurons in different cortical regions in a horizontal view. b, The flattened view of the mouse cortex in the reference atlas showed the anatomical locations of the input neurons in different cortical areas that target GABAergic neurons in the mPFC. The limbic cortex includes the orbital cortex, agranular insular cortex and cingulate cortex. The motor cortex consists of the frontal association cortex, secondary motor cortex and primary motor cortex. The primary somatosensory cortex, primary visual cortex and secondary visual cortex comprise the sensory cortex. The associative cortex mainly includes the retrosplenial granular cortex. The limbic areas are shown in red, the motor areas are shown in blue, the sensory areas are shown in green and the associative areas are shown in yellow. c, Cortical input neurons were mainly located in the limbic areas of the cortex (SST+, n = 18 mice; PV+, n = 14 mice; VIP+, n = 10 mice, data shown as mean ± s.e.m.). d, Cortical input neurons were mainly located in layers II/III of the cortex (SST+, n = 8 mice; PV+, n = 8 mice; VIP+, n = 8 mice, data shown as mean ± s.e.m.). e, The distribution of cortical input neurons in RSP and SSp. There are differences in the layer distribution of cortical input neurons between RSP and SSp (SST+, n = 18 mice; PV+, n = 14 mice; VIP+, n = 10 mice). f,g, Quantification of cortical input neurons to the PL (f) and ILA (g) areas in grouped cortical areas (SST+, n = 8 mice; PV+, n = 8 mice; VIP+, n = 8 mice, data shown as mean ± s.e.m.). The cortical input neurons in the limbic cortex, motor cortex and associative cortex were mainly located in layers II/III, while the cortical input neurons in the sensory cortex were mainly located in layer V. h, Quantification of cortical input neurons to the PL and ILA areas in each individual cortical area (SST+, n = 8 mice; PV+, n = 8 mice; VIP+, n = 8 mice, data shown as mean ± s.e.m.). Scale bar, e, 500 µm. A, anterior; P, posterior; L, left; R, right; RSP, retrosplenial area; SSp, primary somatosensory area.

Fig. 7 | Characterization of the morphological properties of the cortical neurons that directly input to GABAergic neurons in the mPFC. a, GABAergic neurons in the mPFC receive inputs from other cortical areas. b, Enlarged image of boxed area in a showing the input cortical neurons in layers II/III and V (SST+, n = 18 mice; PV+, n = 14 mice; VIP+, n = 10 mice). c, Eighty-six traced neurons were registered to the Allen CCF v.3.0. Neurons in layers II/III are shown in red, neurons in layer V are shown in blue, and neurons in layer VI are shown in green. d, Neurons that target SST+, PV+ and VIP+ neurons are shown in different brain frameworks. e, Seven different types of cortical neurons that target GABAergic neurons in the mPFC. f, The dendritic morphologies of seven different types of cortical neurons that target GABAergic neurons in the mPFC. Layer II/III neurons are shown in red. Layer V associative neurons, callosal neurons, corticofugal non-SP neurons, corticospinal neurons and stellate neurons are shown in blue, while layer VI neurons are shown in green. g,h, Quantitative comparison of the fine morphology of four types of different pyramidal neurons in layer V that target GABAergic neurons in the mPFC. Histograms of the dendrite branch numbers (g) and the apical dendrite branch numbers (h) (g, one-way ANOVA followed by Tukey’s post hoc tests, callosal neurons, n = 19, associative neurons, n = 16, corticofugal neurons, n = 17, corticospinal neurons, n = 5, **P < 0.01, ***P < 0.001, ****P < 0.0001, callosal neurons versus corticofugal neurons, P = 0.0016, callosal neurons versus corticospinal neurons, P < 0.0001, corticofugal neurons versus corticospinal neurons, P = 0.0007, corticospinal neurons versus associative neurons, P < 0.0001, data shown as mean ± s.e.m.; h, callosal neurons, n = 19, associative neurons, n = 16, two-tailed unpaired t-test, P = 0.0042, data shown as mean ± s.e.m.). i, A model of different cortical neuron inputs to GABAergic neurons in the mPFC. Scale bar, a, 500 µm; b, 100 µm. CON, contralateral; A, anterior; P, posterior; M, medial; L, lateral; D, dorsal; V, ventral.
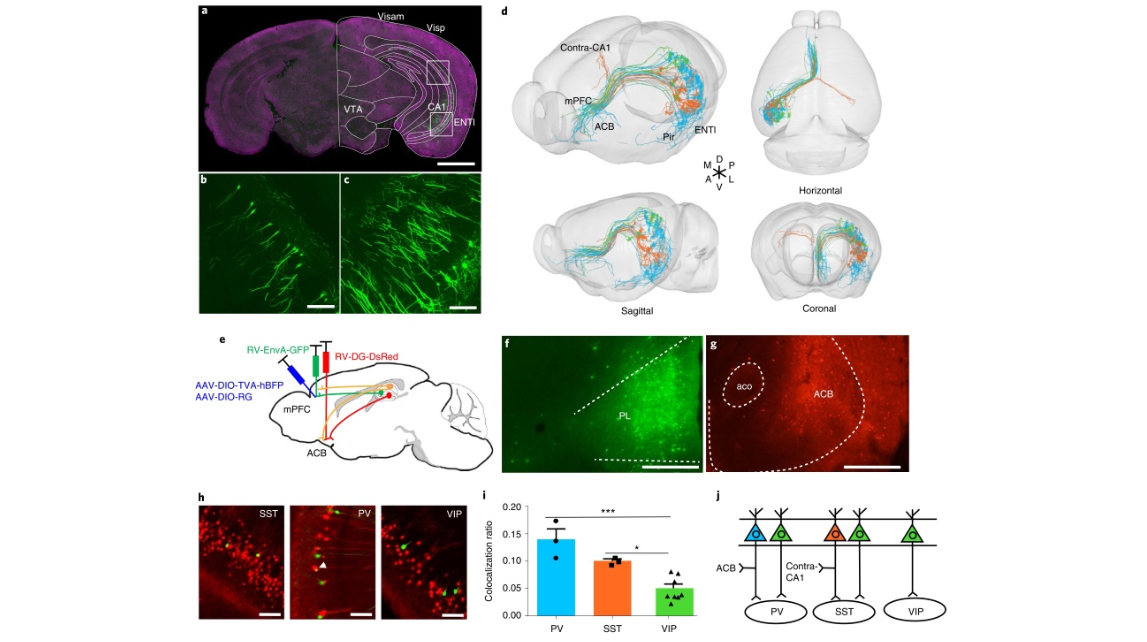
Fig. 8 | Characterization of the morphological properties of the hippocampal pyramidal neurons that directly input to GABAergic neurons in the mPFC. a, A 50-µm projection image showing input cells in thehippocampus and midbrain. b,c, Enlarged images of the boxed areas in a (SST+, n = 18 mice; PV+, n = 14 mice; VIP+, n = 10 mice). d, Thirty-three traced hippocampal pyramidal neurons that target GABAergic neurons in the mPFC. Neurons targeting SST+ neurons in the mPFC are shown in orange, neurons targeting PV+ neurons in the mPFC are shown in blue, and neurons targeting VIP+ neurons in the mPFC are shown in green. Neurons targeting SST+ neurons in the mPFC can send collateral projections to the contralateral CA1 region, while neurons targeting PV+ neurons in the mPFC can simultaneously project to the ACB. e, The strategy for labeling hippocampal pyramidal neurons that simultaneously target GABAergic neurons in the mPFC and ACB. f,g, The injection sites of the PL area and ACB. h, The neurons in the hippocampus that target GABAergic neurons in the mPFC are labeled by GFP, and the neurons in the hippocampus that project to the ACB are labeled by DsRed. The arrowhead shows the dual-color-labeled neurons in the hippocampus (SST+, n = 3 mice; PV+, n = 3 mice; VIP+, n = 8 mice). i, Neurons in the hippocampus that target PV+ neurons in the mPFC tend to project to the ACB simultaneously (one-way ANOVA followed by Tukey’s post hoc tests, *P < 0.05, ***P < 0.001, SST+, n = 3 mice; PV+, n = 3 mice; VIP+, n = 8 mice, PV+ versus VIP+, P = 0.0003, SST+ versus VIP+, P = 0.025, data shown as mean ± s.e.m.) j, A model of hippocampal pyramidal neurons targeting different GABAergic neurons in the mPFC. Scale bars, a,f,g, 1 mm; b,c,h, 100 µm.
cover
Fig. 1 | Characterization of monosynaptic inputs to three types of interneurons in different subregions of the mPFC. a, AAV helper virus and genetically modified rabies virus pseudotyped with EnvA. The RG gene is replaced by EGFP. The experimental strategy and time line are shown on the right and below. b,c, Characterization of the injection site at the PL (b) and ILA areas (c). d, Enlarged image of boxed area in c showing the starter cells (yellow) and local input cells (green). e, Relationship between starter cell and long-range input cells; 28 mice were used for the analysis. Units indicate numbers of neurons. f, Distribution of the starter cells in each cortical area when targeting the PL or ILA areas; 9 mice with PL targeting and 10 mice with ILA targeting were used for the analysis. g, Layer distribution of starter cells. SST+, n = 12 mice; PV+, n = 8 mice; VIP+, n = 8 mice. h, Main steps of data generation and processing. The virus-labeled samples were imaged using a whole-brain imaging system, and the raw data were analyzed and registered to the Allen CCF v.3.0. Scale bars, b,c, 1 mm; d, 100 µm. ACA, anterior cingulate area; DP, dorsal peduncular area.
Fig. 2 | Visualization of the whole-brain input neurons to three types of interneurons in two subregions of the mPFC and quantification of the input neurons in individual brain regions. a, AAV helper virus was injected into the PL and ILA areas, RV-EnvA-GFP (green dots) was injected into the PL, and RV-EnvA-DsRed (red dots) was injected into the ILA area. The somas of RV-labeled neurons were extracted by NeuroGPS and registered to the Allen CCF v.3.0. b. Proportions of long-range inputs to PV+, SST+ and VIP+ neurons in two subregions of the mPFC across individual brain areas. One-way ANODRVA followed by Tukey’s post hoc tests, *P < 0.05, **P < 0.01, ****P < 0.0001; SST+, n = 18 mice; PV+, n = 14 mice; VIP+ , n = 10 mice; for detailed P values, see text. Data shown as mean ± s.e.m. See the details in Supplementary Table 4. A list of abbreviations is provided in Supplementary Table 15.
Fig. 3 | Modulation of GABAergic neurons in the mPFC by multiple neurotransmitters. a, GABAergic neurons in the mPFC receive direct inputs from the basal forebrain (SST+, n = 18 mice; PV+, n = 14 mice; VIP+, n = 10 mice). b, GABAergic neurons in the mPFC receive direct inputs from raphe nuclei (SST+, n = 18 mice; PV+, n = 14 mice; VIP+, n = 10 mice). c,d, Both PV+ neurons and cholinergic neurons in the basal forebrain form monosynaptic inputs to GABAergic neurons in the mPFC, and most of the cholinergic neurons also express EAAC1 (PV and CHAT double immunostaining, SST+, n = 6 mice; PV+, n = 8 mice; VIP+, n = 8 mice; CHAT and EAAC1 double immunostaining, SST+, n = 6 mice; PV+, n = 5 mice; VIP+, n = 8 mice). e, Serotonergic neurons in raphe nuclei directly input to GABAergic neurons in the medial cortex, and most of them express EAAC1 (SST+, n = 6 mice; PV+, n = 6 mice; VIP+, n = 8 mice). f, Quantification of EGFP-labeled neurons that are cholinergic and PV+ (SST+, n = 6 mice; PV+, n = 8 mice; VIP+, n = 8 mice, data shown as mean ± s.e.m.). g, Quantification of EGFP-labeled neurons that are cholinergic and EAAC1+ (SST+, n = 6 mice; PV+, n = 5 mice; VIP+, n = 8 mice, data shown as mean ± s.e.m.). h, Quantification of EGFP-labeled neurons that are serotonergic and EAAC1+ (SST+, n = 6 mice; PV+, n = 6 mice; VIP+, n = 8 mice, data shown as mean ± s.e.m.). Scale bars, a,b, 200 µm; c–e, 50 µm.
Fig. 4 | Characterization of the functional inputs from cholinergic neurons in basal forebrain and serotonin neurons in raphe nuclei to GABAergic neurons in the mPFC. a, Experimental designs for recordings of GABAergic neurons in the mPFC following AAV-DIO-ChR2 injections in VDB and HDB of chatCre:GAD67-GFP mice. b, Experimental designs for recordings of GABAergic neurons in the mPFC following AAV-DIO-ChR2 injections in raphe nuclei of sert-Cre:GAD67-GFP mice. c,d, Immunostaining against CHAT and TPH2, respectively, to validate the specificity of ChR2 expression. Enlarged images are given in the boxes in c and d (chat-Cre:GAD67-GFP, n = 6 mice; sert-Cre:GAD67-GFP, n = 6 mice). e, Example traces of GABAergic neuron recordings with paired-pulse laser-evoked stimulation of cholinergic terminals in the mPFC. The EPSCs can be blocked by Mec + MHT (7 of 34 cells in 6 mice). f, Effects of Mec and HMT on EPSCs evoked by blue-light stimulation of chat + fibers when recording GABAergic neurons in the mPFC (7 cells in 6 mice, two-tailed paired t-test, *P < 0.05, aCSF versus Mec + HMT, P = 0.014, Mec + HMT versus Wash, P = 0.038). g, Example traces of GABAergic neuron recordings with paired-pulse laser-evoked stimulation of cholinergic terminals or serotoninergic terminals in the mPFC. The EPSCs can be blocked by DNQX (2 of 34 cells in 6 Chat-Cre:GAD67-GFP mice, 3 of 63 cells in 6 sert-Cre:GAD67-GFP mice). h, Effect of DNQX on EPSCs evoked by blue-light stimulation of chat fibers or 5-hydroxytryptamine fibers when recording GABAergic neurons in the mPFC (5 cells in 6 mice). Scale bars, c,d, 50 µm (two-tailed paired t-test, *P < 0.05, ACSF versus DNQX, P = 0.038, DNQX versus Wash, P = 0.019). aCSF, artificial cerebrospinal fluid; wash, antagonists are washed out with aCSF.
Fig. 5 | A neural circuit among mPFC, Si and AM. a, Labeling direct input neurons in AM and SI to different GABAergic neurons in the mPFC with monosynaptic RV tracing. b, 3D view of the RV-labeled somas and axons in SI and AM. The boxed image in b shows a neuron in the AM and axons from SI (SST+, n = 18 mice; PV+, n = 14 mice; VIP+, n = 10 mice). The arrowhead indicates the axon terminals. c, The morphology of neurons in SI that innervated mPFC and AM (n = 2 mice). d, Labeling direct inputs to neurons in AM that project to the mPFC using the cTRIO strategy. e, The starter cells (yellow) and local input neurons (red) at the RV injection site; n = 6 mice. f,g, Neurons in SI and CPu can directly project to neurons in AM that project to the mPFC, n = 6 mice. h, Strategy for labeling neurons that directly project to the mPFC and indirectly project to the mPFC through AM. i,j, Neurons in SI can directly project to the mPFC and send collateral projections to neurons in AM that project to the mPFC, and a non-cholinergic neuron labeled by GFP and tdTomato is shown in j (n = 4 mice). k, Within MOs, HDB, LHA and CA1, distinct neurons project to the mPFC and AM (MOs, HDB, n = 4 mice; LHA, CA1, n = 3 mice). l, Quantification of inputs to neurons in AM that project to the mPFC, n = 6 mice, data shown as mean ± s.e.m. m, An updated circuitry model among the mPFC, SI and AM. The conventional circuits are shown in black and the circuits revealed in this study are shown in other colors. Scale bar, boxed image in b, 20 µm; i, 1 mm; e–g,k, 100 µm; j, 50 µm. CA1, CA1 area of the hippocampus; CPu, caudoputamen; MO, motor area; LHA, lateral hypothalamic area; L, left; R, right; D, dorsal; V, ventral.
Fig. 6 | Distribution of input neurons in the neocortex to three types of GABAergic neurons in the mPFC. a, The distribution of cortical input neurons in different cortical regions in a horizontal view. b, The flattened view of the mouse cortex in the reference atlas showed the anatomical locations of the input neurons in different cortical areas that target GABAergic neurons in the mPFC. The limbic cortex includes the orbital cortex, agranular insular cortex and cingulate cortex. The motor cortex consists of the frontal association cortex, secondary motor cortex and primary motor cortex. The primary somatosensory cortex, primary visual cortex and secondary visual cortex comprise the sensory cortex. The associative cortex mainly includes the retrosplenial granular cortex. The limbic areas are shown in red, the motor areas are shown in blue, the sensory areas are shown in green and the associative areas are shown in yellow. c, Cortical input neurons were mainly located in the limbic areas of the cortex (SST+, n = 18 mice; PV+, n = 14 mice; VIP+, n = 10 mice, data shown as mean ± s.e.m.). d, Cortical input neurons were mainly located in layers II/III of the cortex (SST+, n = 8 mice; PV+, n = 8 mice; VIP+, n = 8 mice, data shown as mean ± s.e.m.). e, The distribution of cortical input neurons in RSP and SSp. There are differences in the layer distribution of cortical input neurons between RSP and SSp (SST+, n = 18 mice; PV+, n = 14 mice; VIP+, n = 10 mice). f,g, Quantification of cortical input neurons to the PL (f) and ILA (g) areas in grouped cortical areas (SST+, n = 8 mice; PV+, n = 8 mice; VIP+, n = 8 mice, data shown as mean ± s.e.m.). The cortical input neurons in the limbic cortex, motor cortex and associative cortex were mainly located in layers II/III, while the cortical input neurons in the sensory cortex were mainly located in layer V. h, Quantification of cortical input neurons to the PL and ILA areas in each individual cortical area (SST+, n = 8 mice; PV+, n = 8 mice; VIP+, n = 8 mice, data shown as mean ± s.e.m.). Scale bar, e, 500 µm. A, anterior; P, posterior; L, left; R, right; RSP, retrosplenial area; SSp, primary somatosensory area.
Fig. 7 | Characterization of the morphological properties of the cortical neurons that directly input to GABAergic neurons in the mPFC. a, GABAergic neurons in the mPFC receive inputs from other cortical areas. b, Enlarged image of boxed area in a showing the input cortical neurons in layers II/III and V (SST+, n = 18 mice; PV+, n = 14 mice; VIP+, n = 10 mice). c, Eighty-six traced neurons were registered to the Allen CCF v.3.0. Neurons in layers II/III are shown in red, neurons in layer V are shown in blue, and neurons in layer VI are shown in green. d, Neurons that target SST+, PV+ and VIP+ neurons are shown in different brain frameworks. e, Seven different types of cortical neurons that target GABAergic neurons in the mPFC. f, The dendritic morphologies of seven different types of cortical neurons that target GABAergic neurons in the mPFC. Layer II/III neurons are shown in red. Layer V associative neurons, callosal neurons, corticofugal non-SP neurons, corticospinal neurons and stellate neurons are shown in blue, while layer VI neurons are shown in green. g,h, Quantitative comparison of the fine morphology of four types of different pyramidal neurons in layer V that target GABAergic neurons in the mPFC. Histograms of the dendrite branch numbers (g) and the apical dendrite branch numbers (h) (g, one-way ANOVA followed by Tukey’s post hoc tests, callosal neurons, n = 19, associative neurons, n = 16, corticofugal neurons, n = 17, corticospinal neurons, n = 5, **P < 0.01, ***P < 0.001, ****P < 0.0001, callosal neurons versus corticofugal neurons, P = 0.0016, callosal neurons versus corticospinal neurons, P < 0.0001, corticofugal neurons versus corticospinal neurons, P = 0.0007, corticospinal neurons versus associative neurons, P < 0.0001, data shown as mean ± s.e.m.; h, callosal neurons, n = 19, associative neurons, n = 16, two-tailed unpaired t-test, P = 0.0042, data shown as mean ± s.e.m.). i, A model of different cortical neuron inputs to GABAergic neurons in the mPFC. Scale bar, a, 500 µm; b, 100 µm. CON, contralateral; A, anterior; P, posterior; M, medial; L, lateral; D, dorsal; V, ventral.
Fig. 8 | Characterization of the morphological properties of the hippocampal pyramidal neurons that directly input to GABAergic neurons in the mPFC. a, A 50-µm projection image showing input cells in thehippocampus and midbrain. b,c, Enlarged images of the boxed areas in a (SST+, n = 18 mice; PV+, n = 14 mice; VIP+, n = 10 mice). d, Thirty-three traced hippocampal pyramidal neurons that target GABAergic neurons in the mPFC. Neurons targeting SST+ neurons in the mPFC are shown in orange, neurons targeting PV+ neurons in the mPFC are shown in blue, and neurons targeting VIP+ neurons in the mPFC are shown in green. Neurons targeting SST+ neurons in the mPFC can send collateral projections to the contralateral CA1 region, while neurons targeting PV+ neurons in the mPFC can simultaneously project to the ACB. e, The strategy for labeling hippocampal pyramidal neurons that simultaneously target GABAergic neurons in the mPFC and ACB. f,g, The injection sites of the PL area and ACB. h, The neurons in the hippocampus that target GABAergic neurons in the mPFC are labeled by GFP, and the neurons in the hippocampus that project to the ACB are labeled by DsRed. The arrowhead shows the dual-color-labeled neurons in the hippocampus (SST+, n = 3 mice; PV+, n = 3 mice; VIP+, n = 8 mice). i, Neurons in the hippocampus that target PV+ neurons in the mPFC tend to project to the ACB simultaneously (one-way ANOVA followed by Tukey’s post hoc tests, *P < 0.05, ***P < 0.001, SST+, n = 3 mice; PV+, n = 3 mice; VIP+, n = 8 mice, PV+ versus VIP+, P = 0.0003, SST+ versus VIP+, P = 0.025, data shown as mean ± s.e.m.) j, A model of hippocampal pyramidal neurons targeting different GABAergic neurons in the mPFC. Scale bars, a,f,g, 1 mm; b,c,h, 100 µm.
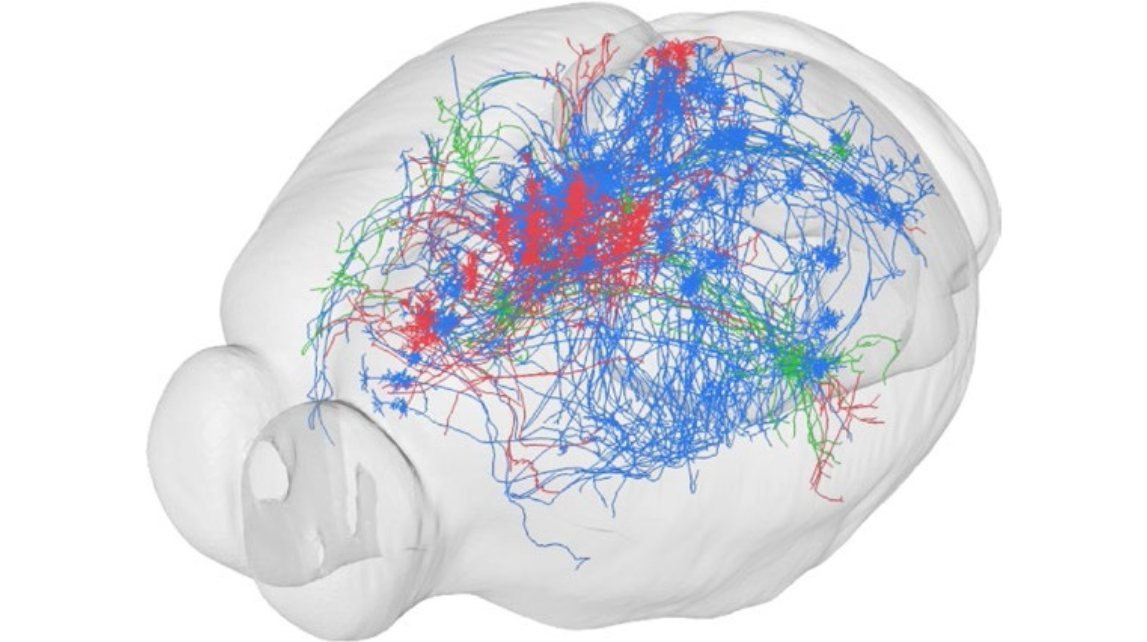
2019年7月8日,武汉光电国家研究中心骆清铭教授团队使用fMOST技术,详细描绘了小鼠内侧前额叶皮层γ-氨基丁酸(GABA)能神经元长程输入环路的全脑图谱。文章发表在《自然-神经科学》(Nature Neuroscience)杂志。
参考文献
参考文献[1]:Qingtao Sun,et al., A whole-brain map of long-range inputs to GABAergic interneurons in the mouse medial prefrontal cortex.,Nat Neurosci.Published: 08 July 2019.