

单个神经元的细胞特异性和投影特异性脑全面重建
染色方法:
病毒示踪标记
标记方法:
EGFP、EYFP、 ERFP、 mCherry、 Tdtomato
包埋方法:
树脂包埋
成像平台:
BioMapping 5000

cover
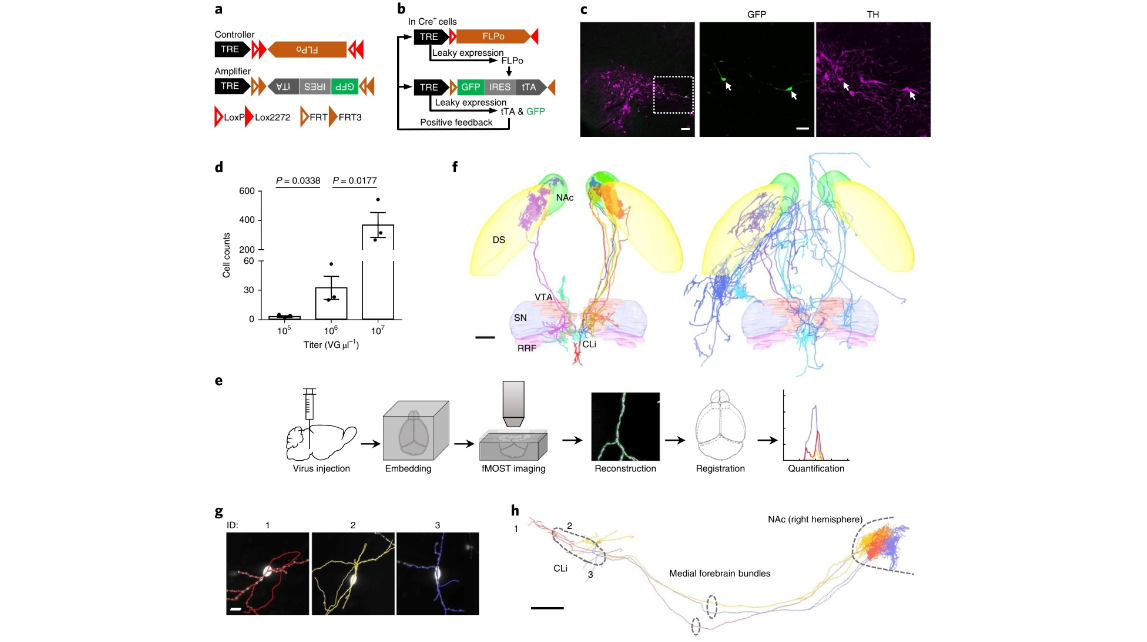
Fig. 1 | a dual-aaV sparse labeling system for tunable labeling of genetically defined neurons and whole-brain single-neuron reconstruction. a, Design of dual-AAV sparse labeling system. b, Working principles of Cre-dependent sparse labeling. c, GFP expression (green) and TH immunoreactivity (magenta) after injection of sparse labeling viruses and AAV-EF1a-DIO-mCherry virus mixture into VTA of DAT-Cre mouse. Right panel, zoomed-in views of boxed region in left panel. Scale bars, 100 µm (left) or 50 µm (right). d, Cell counts of sparsely labeled dopamine neurons shown in Supplementary Fig. 1d (n = 3 mice for each group; P values as indicated in the figure; two-sided t-test corrected for multiple comparisons using the Holm–Sidak method for analyzing the difference between each group). Error bars indicate s.e.m. e, Schematic of single-neuron reconstruction pipeline. f, Overlay of 15 completely reconstructed dopamine neurons (left, dopamine neurons 1–10; right, dopamine neurons 11–15) registered to a reference brain. Color-coding for reconstructed dopamine neurons is consistent in all figures. DS, dorsal striatum; NAc, nucleus accumbens; SN, substantia nigra; RRF, retrorubral field, CLi, central linear nucleus. Scale bar, 500 µm. See Supplementary Table 2 for detailed quantification of each neuron. g, fMOST images of somata and dendrites of three sparsely labeled dopamine neurons, overlaid with reconstruction. Scale bar, 15 µm. h, Complete reconstruction of the three dopamine neurons shown in g. Scale bar, 500 µm.

Fig. 2 | Projection-specific sparse labeling and brain-wide reconstruction of individual cortical pyramidal neurons. a, Schematic of projection-specific sparse labeling strategy. b, Virus injection paradigm for sparsely labeling corticostriatal neurons. Sparse labeling virus mixture was injected into cortical areas. AAV-retro-Cre was injected into dorsal striatum on the ipsilateral or contralateral side. c, Sagittal view of a fully reconstructed pyramidal tract neuron (PT neuron 2). d, fMOST image stacks of boxed regions in c showing structures near soma (region 1) and distal axons in striatum (region 2). Zoomed-in views, right panels. Scale bars, 50 µm (d (1), left; d (2), left), 25 µm (d (1), middle), 10 µm (d (1), right), or 20 µm (d (2), right). e, Overlay of nine corticostriatal neurons (left, four pyramidal tract neurons; right, five intratelencephalic neurons) registered to a reference brain. Color-coding for reconstructed corticostriatal neurons is consistent in all figures. Scale bar, 1,000 µm.
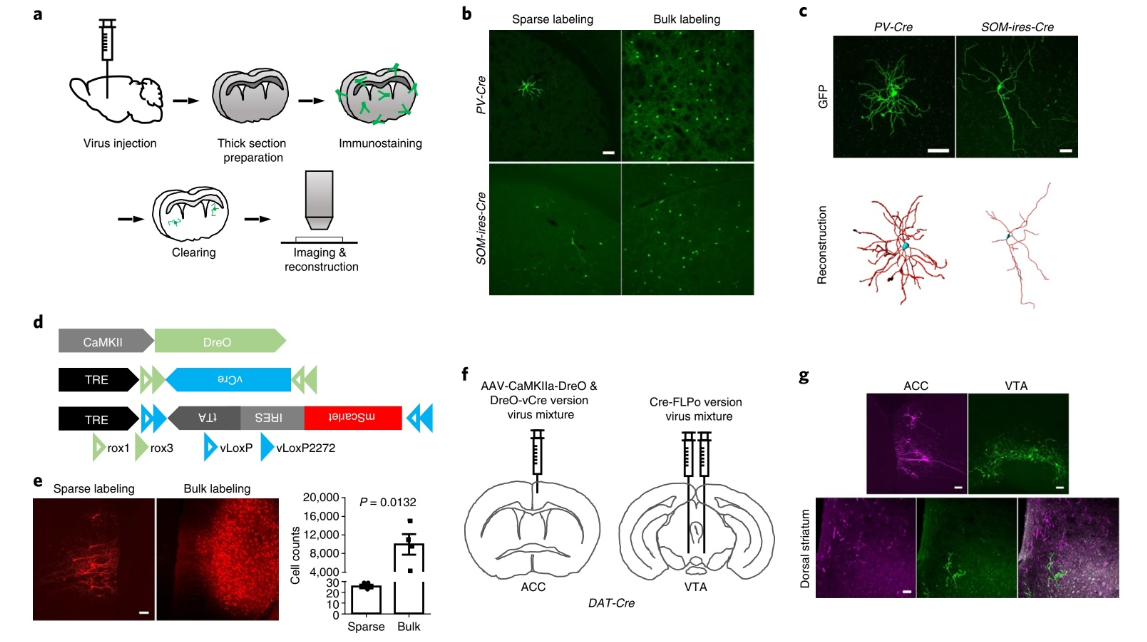
Fig. 3 | extending the dual-aaV sparse labeling system to tissue-clearing techniques and dual-color labeling. a, The workflow for neuronal reconstruction in thick brain sections using the dual-AAV sparse labeling system and tissue clearing techniques. b, Sparse labeling of striatal PV+ and SOM+ interneurons. For comparison, traditional bulk labeling was performed using AAV-EF1a-DIO-mGFP. Scale bar, 100 µm. c, Reconstruction of dendrites of striatal PV+ and SOM+ interneurons. Top, maximum-intensity projection of stack images of individual sparsely labeled striatal interneurons. Scale bar, 50 µm. d, Design of DreO-vCre version of sparse labeling system. AAV-CaMKIIa-DreO was constructed for targeted expression of DreO in cortical projection neurons. e, Labeling of cortical projection neurons in ACC by DreO-vCre version of sparse labeling system or bulk labeling. Scale bar, 100 µm. Right, cell counts of labeled neurons in left panel (n = 4 mice for each group; P value as indicated in the figure; two-sided unpaired t-test). Error bars indicate s.e.m. f, Virus injection paradigm for dual-color sparse labeling in the same DAT-Cre mouse brain using two versions of the sparse labeling system. The DreO-vCre-version viruses and AAV-CaMKIIa-DreO were mixed and injected into the ACC. The Cre-FLPo-version viruses were injected into VTA. g, Images of mouse brain injected with two versions of viruses as shown in f. Top, neurons labeled with the Cre-FLPo version (green) and DreO-vCre version (magenta) at corresponding virus injection sites. Bottom, images of dorsal striatum, a common downstream target of ACC projection neurons and VTA dopaminergic neurons. Scale bars, 100 µm.
mov 1. Illustration of whole-brain single-neuron reconstruction pipeline. Illustrative video showing the workflow of the single-neuron reconstruction pipeline, related to Fig. 1e. The pipeline includes virus injection, embedding, fMOST imaging, reconstruction and registration. The brain sample shown in this video (0–27s) is NIBS_DA_1 (refer to Supplementary Table 1 for details), in which five neurons were reconstructed in total. Fifteen neurons reconstructed from three brain samples were registered to a referential brain. In the referential brain, the boundaries of the nucleus accumbens (NAc; green), dorsal striatum (DS; yellow), ventral tegmental area (VTA; red), substantia nigra (SN; blue), retrorubral field (RRF; magenta), and central linear nucleus (CLi; cyan) were defined with respect to the Allen Reference Atlas (ARA) and CCFv3.
mov 2. Highlighting three reconstructed midbrain dopamine neurons projecting to the medial shell of the nucleus accumbens (NAcShMed). Three dopamine neurons reconstructed from brain sample NIBS_DA_1 are highlighted, related to Fig. 1h. The terminal arborizations were unambiguously reconstructed, as is shown in the sliding image stack. The size of the image stack is 750 × 750 × 300 μm3.
cover
Fig. 1 | a dual-aaV sparse labeling system for tunable labeling of genetically defined neurons and whole-brain single-neuron reconstruction. a, Design of dual-AAV sparse labeling system. b, Working principles of Cre-dependent sparse labeling. c, GFP expression (green) and TH immunoreactivity (magenta) after injection of sparse labeling viruses and AAV-EF1a-DIO-mCherry virus mixture into VTA of DAT-Cre mouse. Right panel, zoomed-in views of boxed region in left panel. Scale bars, 100 µm (left) or 50 µm (right). d, Cell counts of sparsely labeled dopamine neurons shown in Supplementary Fig. 1d (n = 3 mice for each group; P values as indicated in the figure; two-sided t-test corrected for multiple comparisons using the Holm–Sidak method for analyzing the difference between each group). Error bars indicate s.e.m. e, Schematic of single-neuron reconstruction pipeline. f, Overlay of 15 completely reconstructed dopamine neurons (left, dopamine neurons 1–10; right, dopamine neurons 11–15) registered to a reference brain. Color-coding for reconstructed dopamine neurons is consistent in all figures. DS, dorsal striatum; NAc, nucleus accumbens; SN, substantia nigra; RRF, retrorubral field, CLi, central linear nucleus. Scale bar, 500 µm. See Supplementary Table 2 for detailed quantification of each neuron. g, fMOST images of somata and dendrites of three sparsely labeled dopamine neurons, overlaid with reconstruction. Scale bar, 15 µm. h, Complete reconstruction of the three dopamine neurons shown in g. Scale bar, 500 µm.
Fig. 2 | Projection-specific sparse labeling and brain-wide reconstruction of individual cortical pyramidal neurons. a, Schematic of projection-specific sparse labeling strategy. b, Virus injection paradigm for sparsely labeling corticostriatal neurons. Sparse labeling virus mixture was injected into cortical areas. AAV-retro-Cre was injected into dorsal striatum on the ipsilateral or contralateral side. c, Sagittal view of a fully reconstructed pyramidal tract neuron (PT neuron 2). d, fMOST image stacks of boxed regions in c showing structures near soma (region 1) and distal axons in striatum (region 2). Zoomed-in views, right panels. Scale bars, 50 µm (d (1), left; d (2), left), 25 µm (d (1), middle), 10 µm (d (1), right), or 20 µm (d (2), right). e, Overlay of nine corticostriatal neurons (left, four pyramidal tract neurons; right, five intratelencephalic neurons) registered to a reference brain. Color-coding for reconstructed corticostriatal neurons is consistent in all figures. Scale bar, 1,000 µm.
Fig. 3 | extending the dual-aaV sparse labeling system to tissue-clearing techniques and dual-color labeling. a, The workflow for neuronal reconstruction in thick brain sections using the dual-AAV sparse labeling system and tissue clearing techniques. b, Sparse labeling of striatal PV+ and SOM+ interneurons. For comparison, traditional bulk labeling was performed using AAV-EF1a-DIO-mGFP. Scale bar, 100 µm. c, Reconstruction of dendrites of striatal PV+ and SOM+ interneurons. Top, maximum-intensity projection of stack images of individual sparsely labeled striatal interneurons. Scale bar, 50 µm. d, Design of DreO-vCre version of sparse labeling system. AAV-CaMKIIa-DreO was constructed for targeted expression of DreO in cortical projection neurons. e, Labeling of cortical projection neurons in ACC by DreO-vCre version of sparse labeling system or bulk labeling. Scale bar, 100 µm. Right, cell counts of labeled neurons in left panel (n = 4 mice for each group; P value as indicated in the figure; two-sided unpaired t-test). Error bars indicate s.e.m. f, Virus injection paradigm for dual-color sparse labeling in the same DAT-Cre mouse brain using two versions of the sparse labeling system. The DreO-vCre-version viruses and AAV-CaMKIIa-DreO were mixed and injected into the ACC. The Cre-FLPo-version viruses were injected into VTA. g, Images of mouse brain injected with two versions of viruses as shown in f. Top, neurons labeled with the Cre-FLPo version (green) and DreO-vCre version (magenta) at corresponding virus injection sites. Bottom, images of dorsal striatum, a common downstream target of ACC projection neurons and VTA dopaminergic neurons. Scale bars, 100 µm.
mov 1. Illustration of whole-brain single-neuron reconstruction pipeline. Illustrative video showing the workflow of the single-neuron reconstruction pipeline, related to Fig. 1e. The pipeline includes virus injection, embedding, fMOST imaging, reconstruction and registration. The brain sample shown in this video (0–27s) is NIBS_DA_1 (refer to Supplementary Table 1 for details), in which five neurons were reconstructed in total. Fifteen neurons reconstructed from three brain samples were registered to a referential brain. In the referential brain, the boundaries of the nucleus accumbens (NAc; green), dorsal striatum (DS; yellow), ventral tegmental area (VTA; red), substantia nigra (SN; blue), retrorubral field (RRF; magenta), and central linear nucleus (CLi; cyan) were defined with respect to the Allen Reference Atlas (ARA) and CCFv3.
mov 2. Highlighting three reconstructed midbrain dopamine neurons projecting to the medial shell of the nucleus accumbens (NAcShMed). Three dopamine neurons reconstructed from brain sample NIBS_DA_1 are highlighted, related to Fig. 1h. The terminal arborizations were unambiguously reconstructed, as is shown in the sliding image stack. The size of the image stack is 750 × 750 × 300 μm3.
2018年11月19日,北京大学联合华中科技大学武汉光电国家研究中心,使用fMOST技术首次展示了细胞类型和投射特异性的单个神经元的重构,文章发表在《自然-方法》杂志上。
参考文献
参考文献[1]:Rui Lin et al., Cell-type-specific and projection-specific brainwide reconstruction of single neurons. Nature Methods. Published: 19 November 2018. https://doi.org/10.1038/s41592-018-0184-y