

一个高效识别全脑神经回路分子表型的成像系统
染色方法:
病毒示踪标记
标记方法:
EGFP、EYFP、 ERFP、 mCherry、 Tdtomato
包埋方法:
树脂包埋
成像平台:
BioMapping 9000
cover
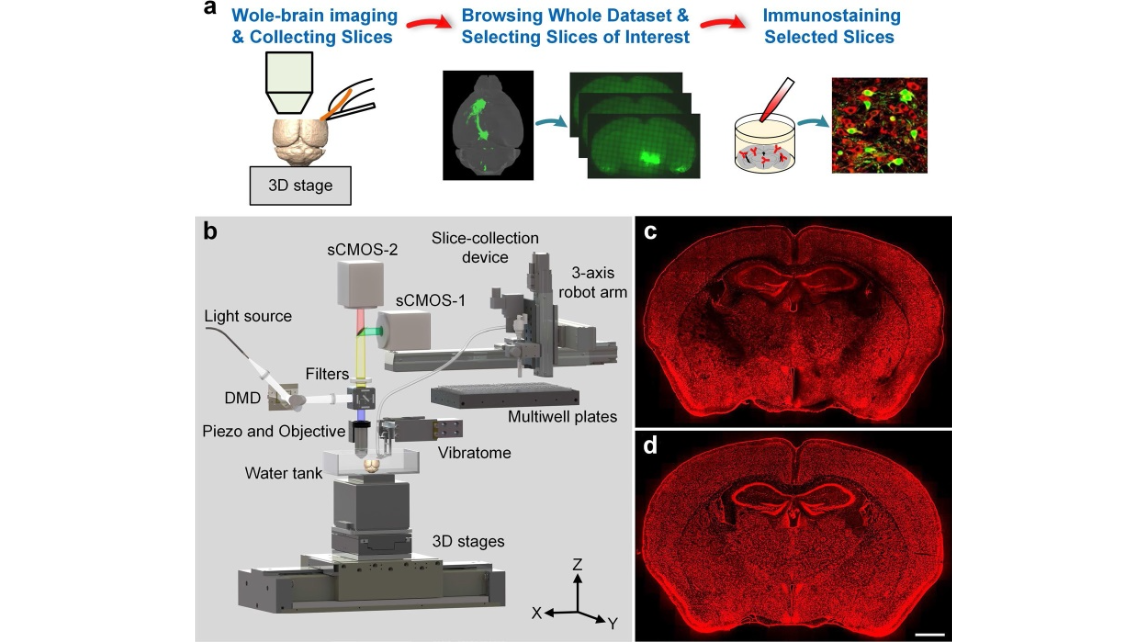
Figure 1. Phenotyping brain-wide neural circuits. (a) Presentation of the whole pipeline. (b) Schematic of the rapid whole-brain optical tomography system with automatic slice collection. (c) and (d) Typical coronal images of propidium iodide (PI)-stained 2 M C57BL/6 J mouse brains acquired by the system before and after optimization. Scale bar: 1 mm.
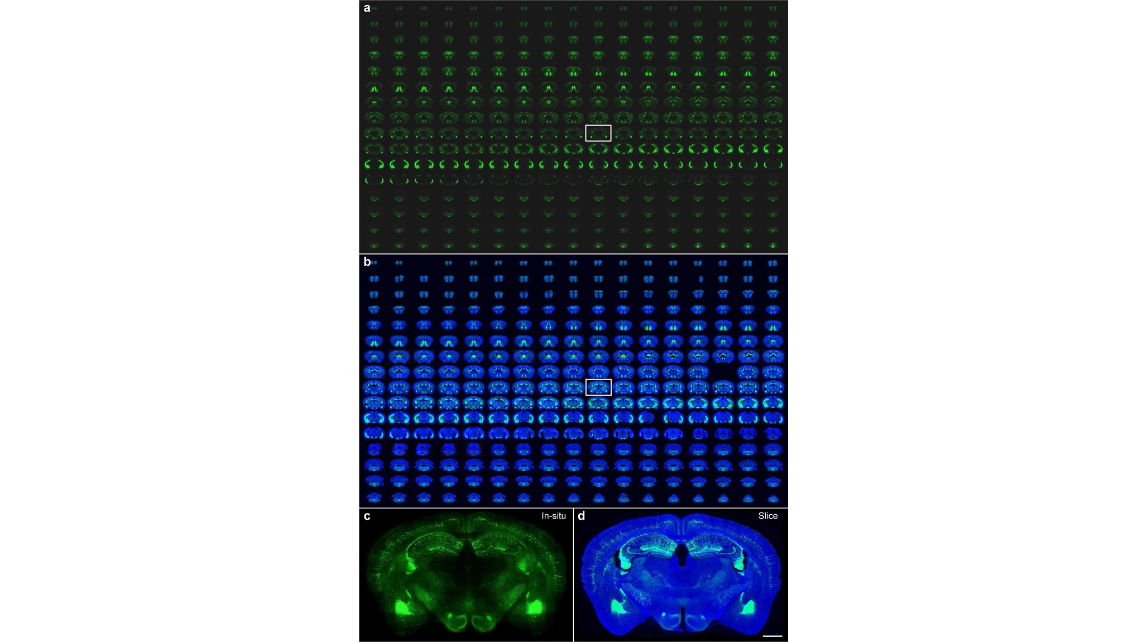
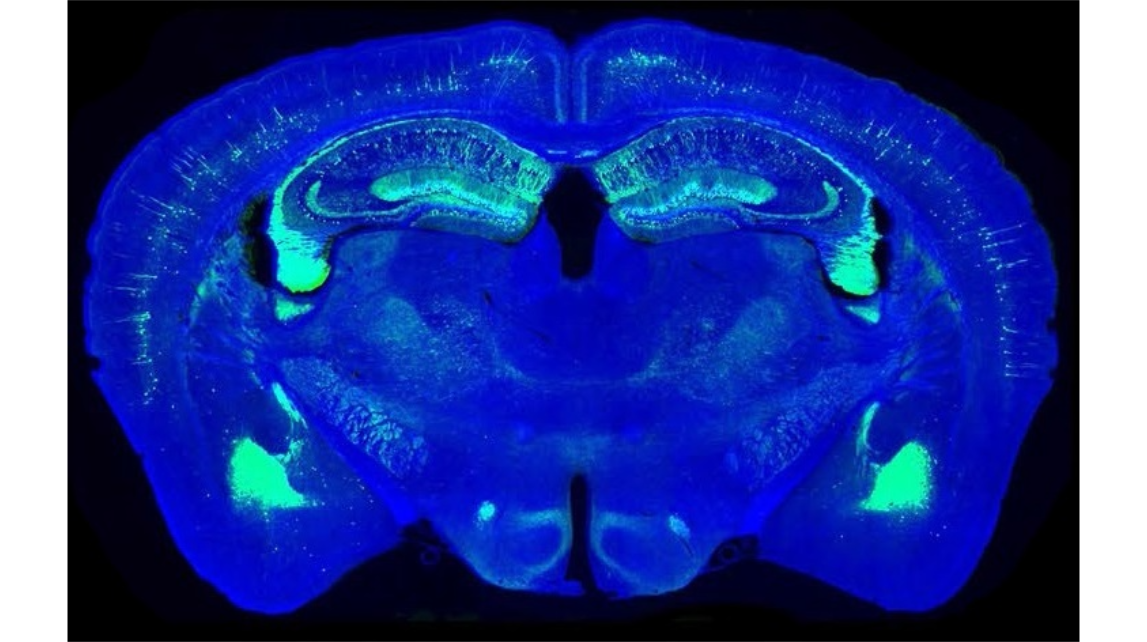
Figure 2. Automatic slice collection of imaging a Thy1-eYFP H-line mouse brain. (a) The brain was imaged by our system as 272 coronal sections at an interval of 50 μm, and all imaged tissue slices were sequentially collected during data acquisition. (b) All collected slices were placed on the slides and imaged with a Nikon Eclipse Ni-E wide-field microscope one-by-one manually. Blue and green represent 4′, 6-diamidino-2- phenylindole (DAPI) staining and YFP-labelled images of the collected slices, respectively. All images are arranged according to the corresponding in situ images, and the blank areas represent the missing slices. Enlarged views of the hippocampal coronal plane are indicated by white rectangles in row 9 and column 10. (c) An in situ image during whole-brain imaging with our system, and (d) the image of the corresponding collected slice imaged with a Zeiss LSM 710 confocal microscope. Scale bars in (c) and (d) are 1 mm.
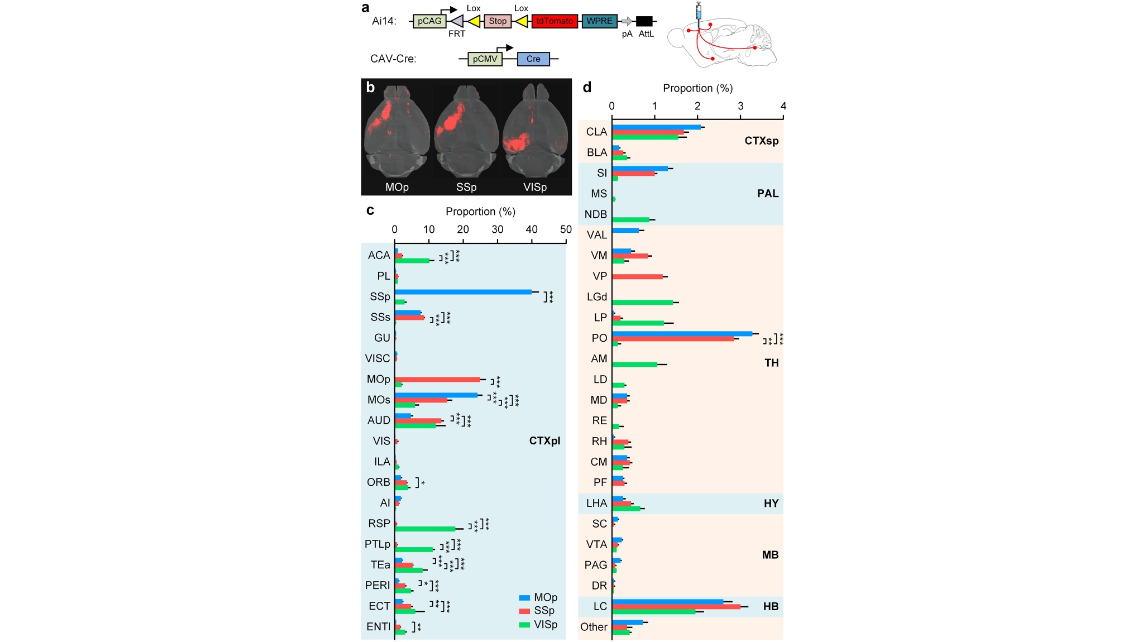
Figure 3. Whole-brain mapping of inputs to MOp, SSp and VISp. (a) Schematic of direct inputs to targeted areas using stereotaxic injections of CAV-Cre. Left side shows the gene elements of the Ai14 Cre-reporter mouse and CAV-Cre used in a labelling experiment. Right side shows that CAV-Cre was injected into the targeted area of a mouse brain. (b) Whole-brain volume rendering of the inputs to MOp, SSp and VISp. (c,d) Quantification of the brain-wide inputs in cortical and subcortical brain areas to MOp, SSp and VISp. Error bars represent SEM. Others represent all other input regions. The significant differences between pairs are indicated by the p value (*p < 0.05, **p < 0.01, and ***p < 0.001). Injection sites were excluded from the data analysis.
Movie 1. Closeup of the system at a vertical view at runtime.
cover
Figure 1. Phenotyping brain-wide neural circuits. (a) Presentation of the whole pipeline. (b) Schematic of the rapid whole-brain optical tomography system with automatic slice collection. (c) and (d) Typical coronal images of propidium iodide (PI)-stained 2 M C57BL/6 J mouse brains acquired by the system before and after optimization. Scale bar: 1 mm.
Figure 2. Automatic slice collection of imaging a Thy1-eYFP H-line mouse brain. (a) The brain was imaged by our system as 272 coronal sections at an interval of 50 μm, and all imaged tissue slices were sequentially collected during data acquisition. (b) All collected slices were placed on the slides and imaged with a Nikon Eclipse Ni-E wide-field microscope one-by-one manually. Blue and green represent 4′, 6-diamidino-2- phenylindole (DAPI) staining and YFP-labelled images of the collected slices, respectively. All images are arranged according to the corresponding in situ images, and the blank areas represent the missing slices. Enlarged views of the hippocampal coronal plane are indicated by white rectangles in row 9 and column 10. (c) An in situ image during whole-brain imaging with our system, and (d) the image of the corresponding collected slice imaged with a Zeiss LSM 710 confocal microscope. Scale bars in (c) and (d) are 1 mm.
Figure 3. Whole-brain mapping of inputs to MOp, SSp and VISp. (a) Schematic of direct inputs to targeted areas using stereotaxic injections of CAV-Cre. Left side shows the gene elements of the Ai14 Cre-reporter mouse and CAV-Cre used in a labelling experiment. Right side shows that CAV-Cre was injected into the targeted area of a mouse brain. (b) Whole-brain volume rendering of the inputs to MOp, SSp and VISp. (c,d) Quantification of the brain-wide inputs in cortical and subcortical brain areas to MOp, SSp and VISp. Error bars represent SEM. Others represent all other input regions. The significant differences between pairs are indicated by the p value (*p < 0.05, **p < 0.01, and ***p < 0.001). Injection sites were excluded from the data analysis.
Movie 1. Closeup of the system at a vertical view at runtime.
2017年10月24日,华中科技大学武汉光电国家研究中心袁菁老师课题组,发展了一种快速的新型fMOST平台,并设计了一种有效的方法来绘制同一个大脑的全脑结构和分子信息: 快速成像和切片以及自动采集所有切片; 通过快速数据浏览方便地选择感兴趣的切片,然后执行选择的切片的事后特定免疫染色。 这一平台显著提高了神经电路分子表型分型的效率,并为特定电路的细胞类型分析提供了自动化和产业化的途径。文章发表在《科学报道》杂志上。
参考文献
参考文献[1]:Jiang T, Long B, Gong H, Xu T, Li X, Duan Z, Li A, Deng L, Zhong Q, Peng X, Yuan J. A platform for efficient identification of molecular phenotypes of brain-wide neural circuits.Sci Rep. (2017) 24;7(1):13891.