

三维分析AD转基因小鼠基底外侧杏仁核树突复杂性
染色方法:
高尔基染色
标记方法:
Golgi染色
包埋方法:
树脂包埋
成像平台:
BioMapping 1000

Fig. 2. 3D reconstruction of neurons in BLA. (a) Minimum projection of coronal images from an APP/PS1 dataset of Golgi-Cox staining, whose sagittal location is presented on the upper left panel (Modified from Paxinos et al.[17]). Thickness is 50 m m while resolution of the raw figure is 0.32 ? 0.32 ? 1 m m. Scale Bar, 500 m m. (b) An enlarged view of amygdala, which identifies LaDL and BLA, Scale Bar, 200 m m. (c) Fine structure of dendritic arbors in 2-D view, Scale bar, 30 m m. (d-e) Main processes of 3-D reconstructions including the raw data importing, neuronal soma positioning, neuronal tracing and 3D checking at last. Scale bar, 50 m m.
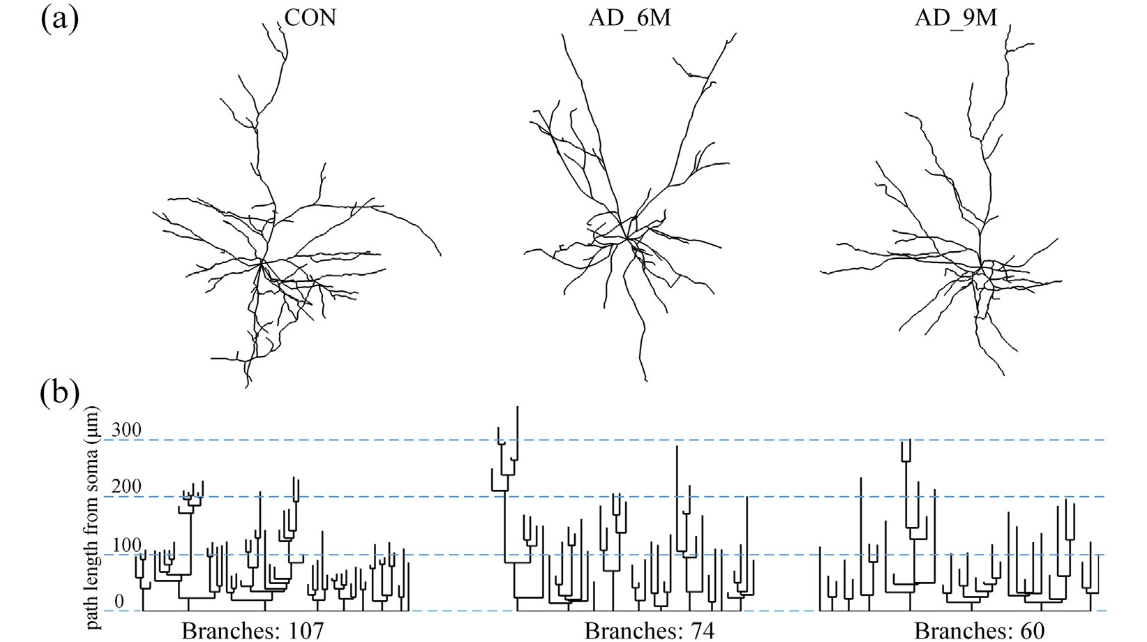
Fig. 3. Dendrograms of neurons in the BLA. (a) 3D reconstructed neurons from different groups (Control, AD_6M and AD_9M, respectively). (b) Corresponding dendrograms show the length and branching pattern for each dendrite of 3 cells. The apical dendrite is at the bottom of each cell's dendrogram. Some apparent differences between groups can be viewed in 2 dimensions.
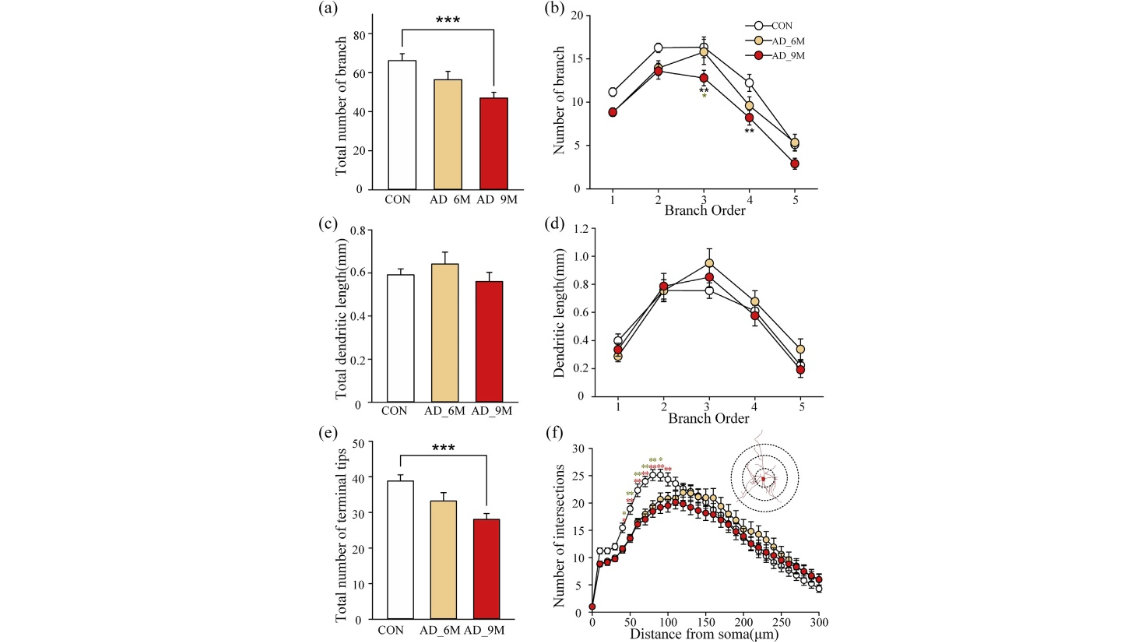
Fig. 4. Progressive changes in dendritic complexity in amygdala of APP/PS1 mice. (a) Average total number of branches of each group. (b) Average branch number from first to fifth order per neuron of each group. (c) Average total dendritic length of each group. (d) Average dendritic length from first to fifth order per neuron of each group. (e) Average total number of terminal tips of each group. (f) Sholl analysis shows the number of intersections with concentric spheres at different distances from the soma (AD_6M group: n ¼ 15; AD_9M group: n ¼ 19; CON group: n ¼ 18, from 2 mice).
Fig. 2. 3D reconstruction of neurons in BLA. (a) Minimum projection of coronal images from an APP/PS1 dataset of Golgi-Cox staining, whose sagittal location is presented on the upper left panel (Modified from Paxinos et al.[17]). Thickness is 50 m m while resolution of the raw figure is 0.32 ? 0.32 ? 1 m m. Scale Bar, 500 m m. (b) An enlarged view of amygdala, which identifies LaDL and BLA, Scale Bar, 200 m m. (c) Fine structure of dendritic arbors in 2-D view, Scale bar, 30 m m. (d-e) Main processes of 3-D reconstructions including the raw data importing, neuronal soma positioning, neuronal tracing and 3D checking at last. Scale bar, 50 m m.
Fig. 3. Dendrograms of neurons in the BLA. (a) 3D reconstructed neurons from different groups (Control, AD_6M and AD_9M, respectively). (b) Corresponding dendrograms show the length and branching pattern for each dendrite of 3 cells. The apical dendrite is at the bottom of each cell's dendrogram. Some apparent differences between groups can be viewed in 2 dimensions.
Fig. 4. Progressive changes in dendritic complexity in amygdala of APP/PS1 mice. (a) Average total number of branches of each group. (b) Average branch number from first to fifth order per neuron of each group. (c) Average total dendritic length of each group. (d) Average dendritic length from first to fifth order per neuron of each group. (e) Average total number of terminal tips of each group. (f) Sholl analysis shows the number of intersections with concentric spheres at different distances from the soma (AD_6M group: n ¼ 15; AD_9M group: n ¼ 19; CON group: n ¼ 18, from 2 mice).
2017年5月6日,华中科技大学武汉光电国家研究中心龚辉教授课题组,利用MOST技术,构建了AD小鼠神经元数据集,并使用 Sholl 方法定量分析了树突分支的解剖学差异, 揭示了AD小鼠早期病理发展过程中的神经解剖学变化。文章发表在《BBRC》杂志上。
参考文献
参考文献[1]:Guo C, Long B, Hu Y, Yuan J, Gong H, Li X. Early-stage reduction of the dendritic complexity in basolateral amygdala of a transgenic mouse model of Alzheimer's disease. Biochem Biophys Res Commun. (2017);486(3):679-685.