

大鼠单细胞分辨全脑网络可视化
染色方法:
高尔基染色
标记方法:
Golgi染色
包埋方法:
树脂包埋
成像平台:
BioMapping 9000
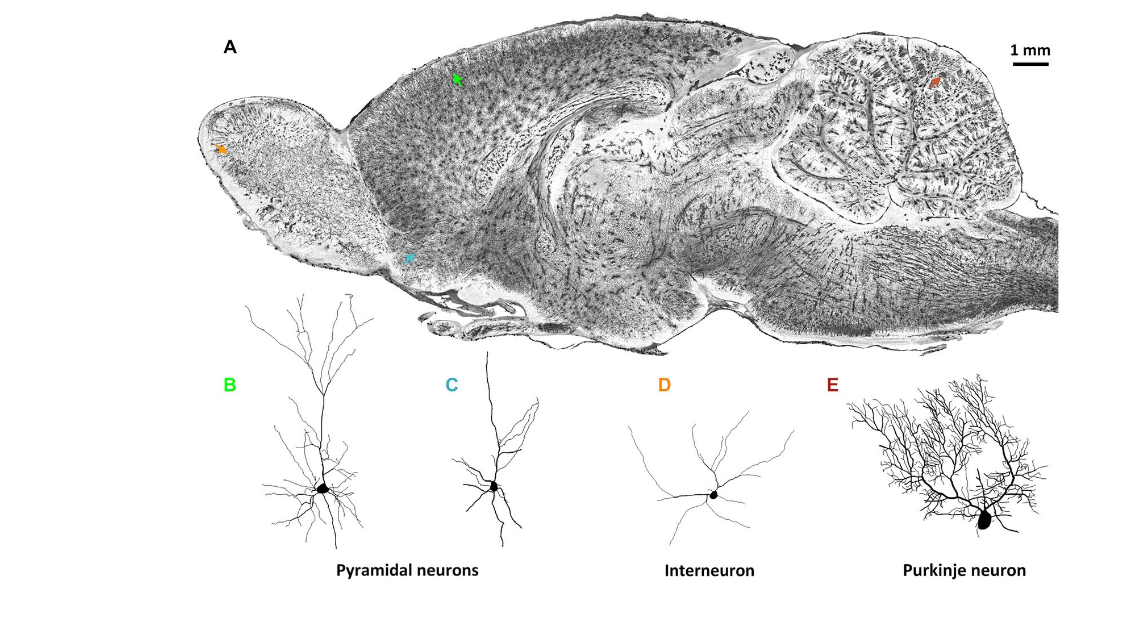
FIGURE 1 | Whole-brain imaging of rat neuronal morphology with Golgi staining (Vbn, 2015). (A) A sagittal image of a 200 µm thickness projection from a whole-brain imaging dataset acquired by MOST method (Li et al., 2010). Arrowheads in different colors in (A) indicate individual neurons. (B) Pyramidal neuron in somato motor cortex (green in (A)); (C) Pyramidal neuron in anterior olfactory nucleus of olfactory bulb (blue); (D) Interneuron in glomerular layer of olfactory bulb (orange); Purkinje cell in cerebellum (brown).
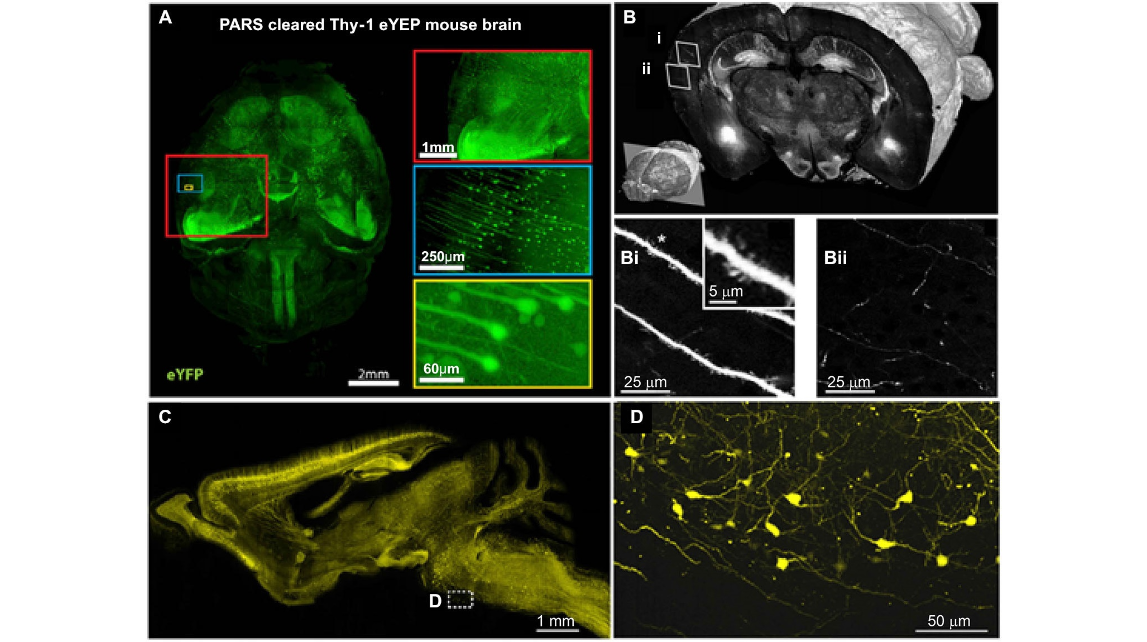
FIGURE 2 | Brain-wide distribution of Thy-1 neurons imaged by LSM, STP and fMOST. (A) Whole-brain image (z = 6 mm) of adult Thy1-eYFP mouse after PARS clearing for 10 days. The boxes on the right show high-magnification images of indicated areas. PARS, perfusion-assisted agent release in situ. Taken from Yang et al. (2014). (B) 3D view of a coronal section of the GFP brain. Lower left: position of the coronal plane in the imaged mouse brain (approximately 2.5 mm from Bregma). Enlarged views demonstrating visualization of dendritic spines (Bi) and fine axon fibers (Bii). Adapted from Ragan et al. (2012). (C) Sagittal image reconstructed from a stack of virtual sagittal sections (thickness: 50 µm) of an adult Thy1-eYFP mouse brain. (D) Higher magnification views of some soma and fine neurites in the white box of (C). (C) and (D) redrawn from the imaging dataset published in Gong et al. (2013).

FIGURE 3 | The reconstruction of the coronal plane imaging (300 µm thick) of GFP-M line mouse brain using fMOST. A 3D reconstruction of the mouse brain is in the top left corner; the cube at the coronal plane presents the spatial location of the data at the center. Six individual pyramidal neurons were segmented and traced, indicated in different colors. Axon arbors extend in the ipsilateral hemisphere and to the caudate putamen in the contralateral hemisphere via the corpus callosum. Redrawn from the imaging dataset published in Gong et al. (2013).
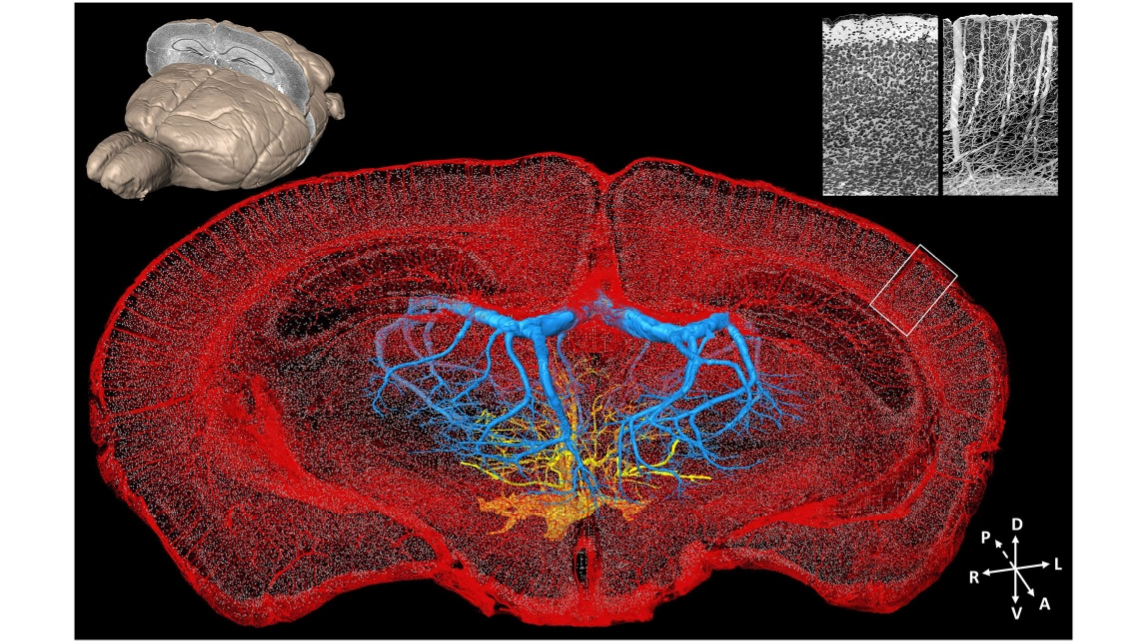
FIGURE 4 | Whole-brain cytoarchitecture and vascular networks acquired by the MOST method. A 3D reconstruction of the mouse brain is in the top left corner; the selected 300 µm slab at the coronal plane presents the spatial location of the data at the center. The center shows the cytoarchitecture and vascular network, simultaneously acquired in the brain. Blue and yellow represents the branches of the longitudinal hippocampal vein and some thalamo-perforating arteries in thalamus, respectively, red represents all else vessels in this data set, and gray dots represent the center of somas. The enlarged views of the cytoarchitecture and vascular architecture of the white rectangle in cortical region in the data at the center are in the top right corner. Redrawn from the imaging dataset published in Wu et al. (2014).
FIGURE 1 | Whole-brain imaging of rat neuronal morphology with Golgi staining (Vbn, 2015). (A) A sagittal image of a 200 µm thickness projection from a whole-brain imaging dataset acquired by MOST method (Li et al., 2010). Arrowheads in different colors in (A) indicate individual neurons. (B) Pyramidal neuron in somato motor cortex (green in (A)); (C) Pyramidal neuron in anterior olfactory nucleus of olfactory bulb (blue); (D) Interneuron in glomerular layer of olfactory bulb (orange); Purkinje cell in cerebellum (brown).
FIGURE 2 | Brain-wide distribution of Thy-1 neurons imaged by LSM, STP and fMOST. (A) Whole-brain image (z = 6 mm) of adult Thy1-eYFP mouse after PARS clearing for 10 days. The boxes on the right show high-magnification images of indicated areas. PARS, perfusion-assisted agent release in situ. Taken from Yang et al. (2014). (B) 3D view of a coronal section of the GFP brain. Lower left: position of the coronal plane in the imaged mouse brain (approximately 2.5 mm from Bregma). Enlarged views demonstrating visualization of dendritic spines (Bi) and fine axon fibers (Bii). Adapted from Ragan et al. (2012). (C) Sagittal image reconstructed from a stack of virtual sagittal sections (thickness: 50 µm) of an adult Thy1-eYFP mouse brain. (D) Higher magnification views of some soma and fine neurites in the white box of (C). (C) and (D) redrawn from the imaging dataset published in Gong et al. (2013).
FIGURE 3 | The reconstruction of the coronal plane imaging (300 µm thick) of GFP-M line mouse brain using fMOST. A 3D reconstruction of the mouse brain is in the top left corner; the cube at the coronal plane presents the spatial location of the data at the center. Six individual pyramidal neurons were segmented and traced, indicated in different colors. Axon arbors extend in the ipsilateral hemisphere and to the caudate putamen in the contralateral hemisphere via the corpus callosum. Redrawn from the imaging dataset published in Gong et al. (2013).
FIGURE 4 | Whole-brain cytoarchitecture and vascular networks acquired by the MOST method. A 3D reconstruction of the mouse brain is in the top left corner; the selected 300 µm slab at the coronal plane presents the spatial location of the data at the center. The center shows the cytoarchitecture and vascular network, simultaneously acquired in the brain. Blue and yellow represents the branches of the longitudinal hippocampal vein and some thalamo-perforating arteries in thalamus, respectively, red represents all else vessels in this data set, and gray dots represent the center of somas. The enlarged views of the cytoarchitecture and vascular architecture of the white rectangle in cortical region in the data at the center are in the top right corner. Redrawn from the imaging dataset published in Wu et al. (2014).
2015年5月28日,华中科技大学武汉光电国家研究中心骆清铭教授课题组袁菁老师对全脑光学断层成像技术进行了综述,介绍了这些新技术在可见脑神经元 / 血管网络方面的研究进展,并对其未来的发展进行了展望。文章发表在《神经解剖前沿》杂志上。
参考文献
参考文献[1]:Yuan J, Gong H, Li A, Li X, Chen S, Zeng S, Luo Q. Visible rodent brain-wide networks at single-neuron resolution. Front Neuroanat. (2015);9:70. (Review)