

成年树鼩前扣带皮层的鉴定
染色方法:
高尔基染色
标记方法:
Golgi染色
包埋方法:
树脂包埋
成像平台:
BioMapping 1000
cover
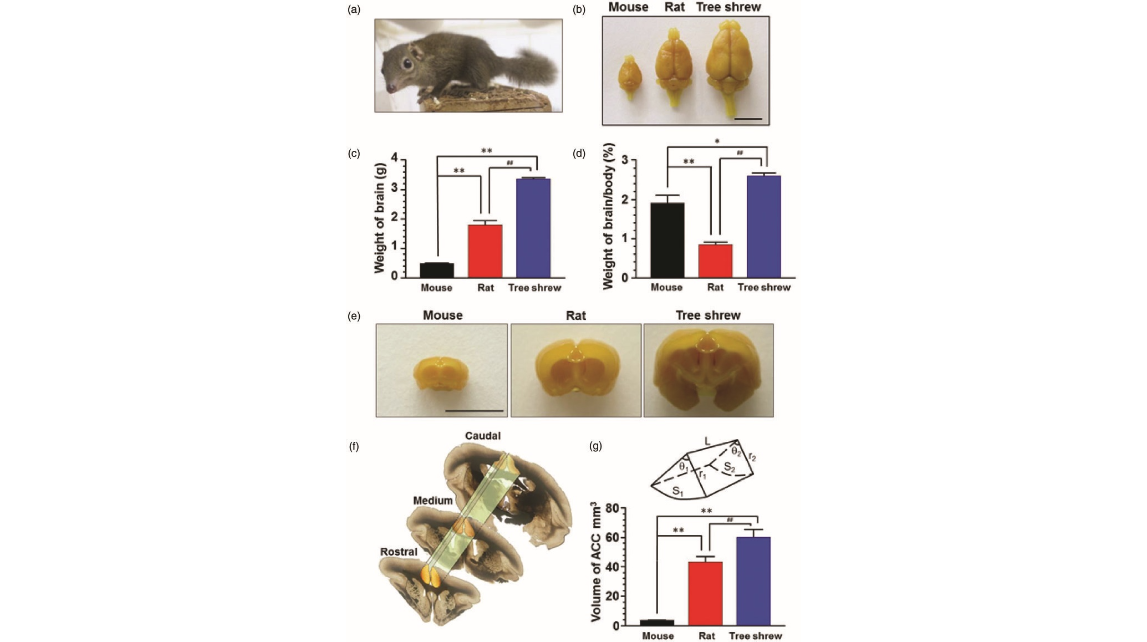
Figure 1. The anatomical property of the brain in tree shrew. (a) A photo of tree shrew in daily life. (b) Fixed whole brain of mouse, rat and tree shrew. Scale bar, 1cm. The weight (c) and proportion of brain (d) in tree shrew were much larger than that of mouse and rat (n¼9, 9, 8 for mouse, rat and tree shrew), *p<0.05; **p<0.01 in comparison with mouse, ## p<0.01 in comparison with rat. (e) Representative coronal sections of forebrains in mouse, rat and tree shrew. The dash lines delineate ACC regions. Scale bar, 1cm. (f) Sample sections showing the rostral, medium and caudal part of ACC in tree shrew. The integrated ACC was framed by dash lines. (g) The diagram showing the cylinder shape of ACC with sectorial section. S1, rostral areas of ACC; r1, radius of rostral ACC; y1, degree of rostral ACC; S2, caudal areas of ACC; r2, radius of caudal ACC; y2, degree of caudal ACC. Statistic results showing the volume of ACC was progressively increased in mouse, rat and tree shrew (n¼3 in each group), **p<0.01 in comparison with mouse, ## p<0.01 in comparison with rat.
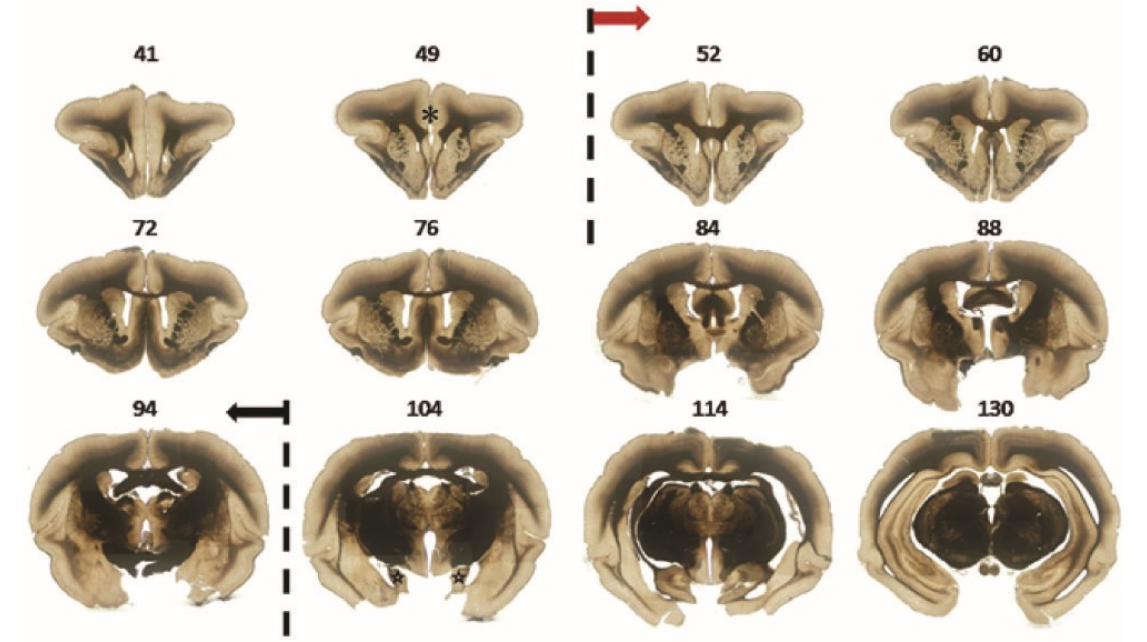
Figure 2. The representative serial sections showing the range of ACC in tree shrew. Sample sections from a stack of 100-mm serial coronal sections. In No. 49 section, prefrontal cortex was indicated by asterisk. Sections from No. 52 to 94 showed the forebrain containing ACC, in which the ACC were framed by dash lines. Sections from No. 104 to 130 showed the forebrain containing posterior cingulate cortex, in which the hippocampus were indicated by stars.
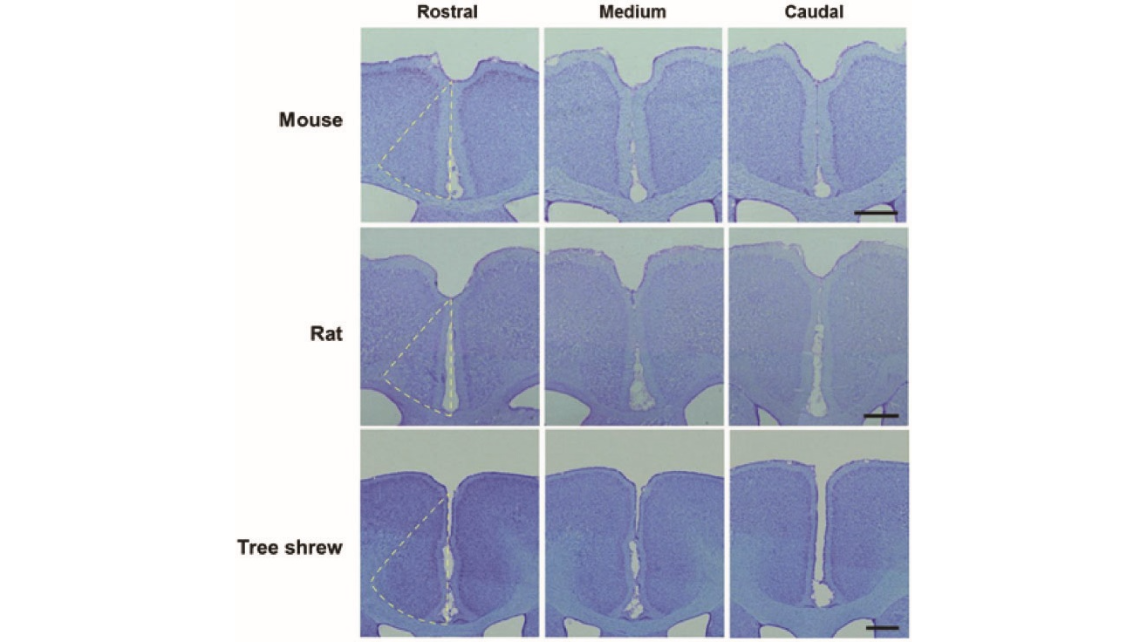
Figure 3. The rostral, medium and caudal part of ACC in tree shrew. Sample sections of Nissl staining showed the rostral, medium and caudal part of ACC in mouse, rat and tree shrew, respectively. The dash lines outline the areas of one side of ACC. Scale bar, 1cm in mouse and 2cm in rat and tree shrew.
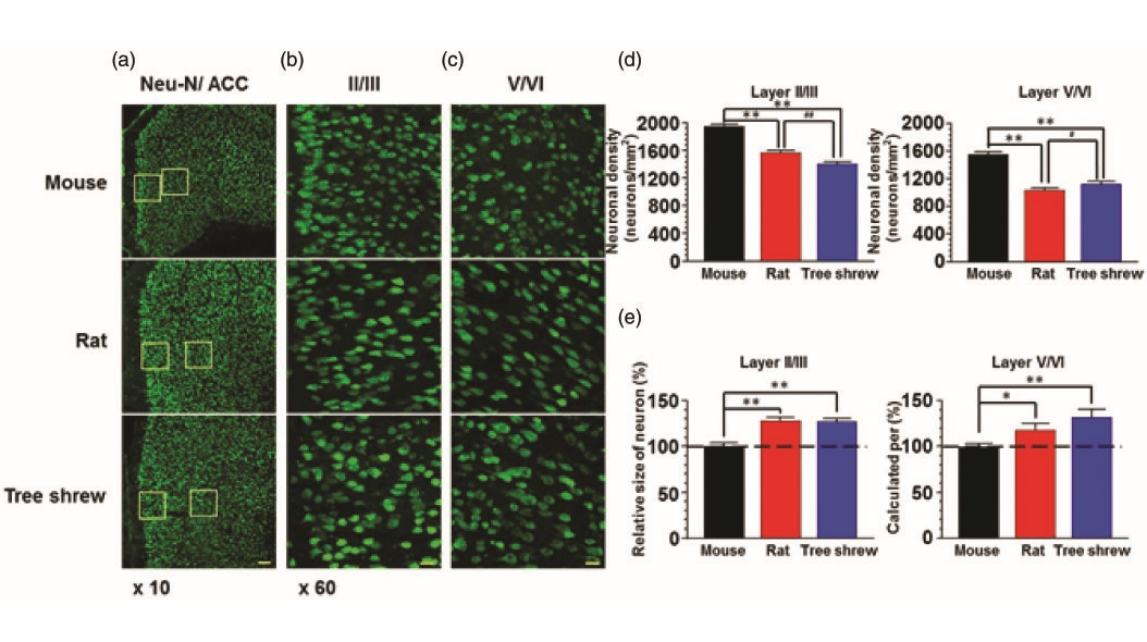
Figure 4. The neuronal distribution in the ACC of tree shrew. (a) Fluorescence images of NeuN-immunostained neurons in the ACC of mouse, rat and tree shrew. The frames in (a) were magnified to show the layers II/III (b) and V/VI (c) of the ACC. Scale bar, 100mm in (a) and 20mm in (b–c). (d) Summarized data showing that the neuronal density in layers II/III and V/VI of rat and tree shrew was less than that of mouse (n¼24 slices/4 animals in each group). **p<0.01 in comparison with mouse, # p<0.05, ## p<0.01 in comparison with rat. (e) The neuronal size in layers II/III and V/VI of rat and tree shrew was larger than that of mouse. *p<0.05; **p<0.01.
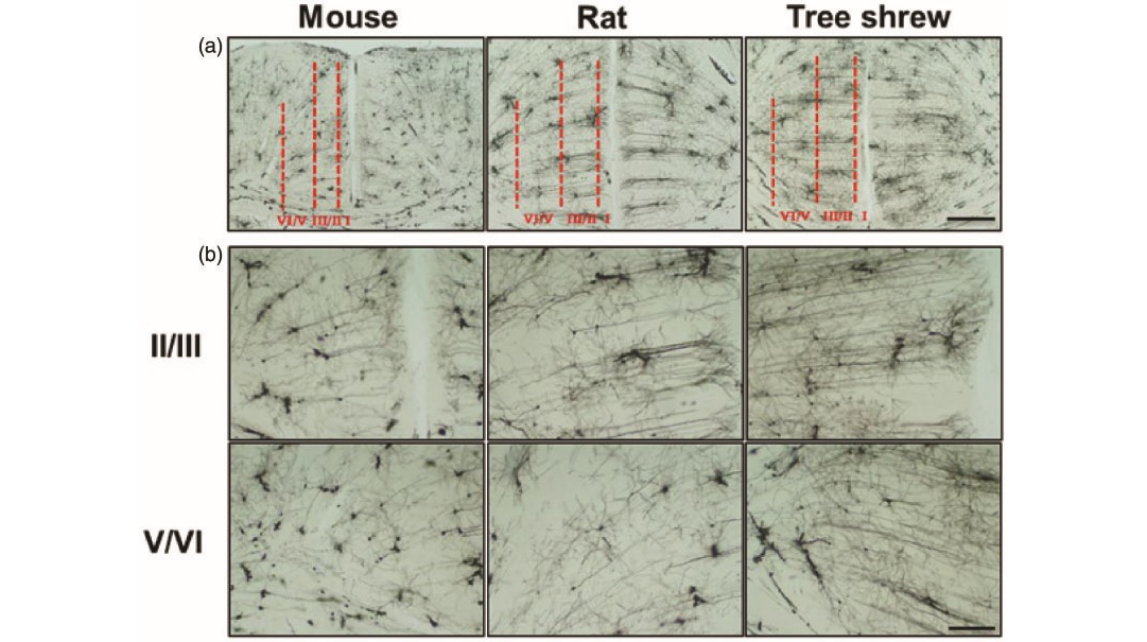
Figure 5. The distribution of Golgi-stained neuronal profiles in the ACC. (a) Lower magnification figures showing the Golgi impregnated neurons in the ACC of mouse, rat and tree shrew. Dashed lines delineate layer distribution of the ACC. (b) Higher magnification figures showing the neurons in layers II/III and V/VI.

Figure 6. The basal and apical dendritic branches of the layer V pyramidal cell-like neurons in the ACC reconstructed by MOST. (a) Sample figures showing the reconstructed pyramidal cell-like neurons in layer Vof ACC of mouse, rat and tree shrew. (b) Basal (red) and apical (blue) dendritic branches of a sample neuron under a concentric shell template for the Sholl analysis. Curves showed the average number of basal (red) and apical (blue) dendritic intersections per shell. (c) The number of basal and apical dendritic branches per 20mm away from the soma. (d) The average number of basal and apical dendritic branches. **p<0.01 in comparison with mouse, ## p<0.01 in comparison with rat.
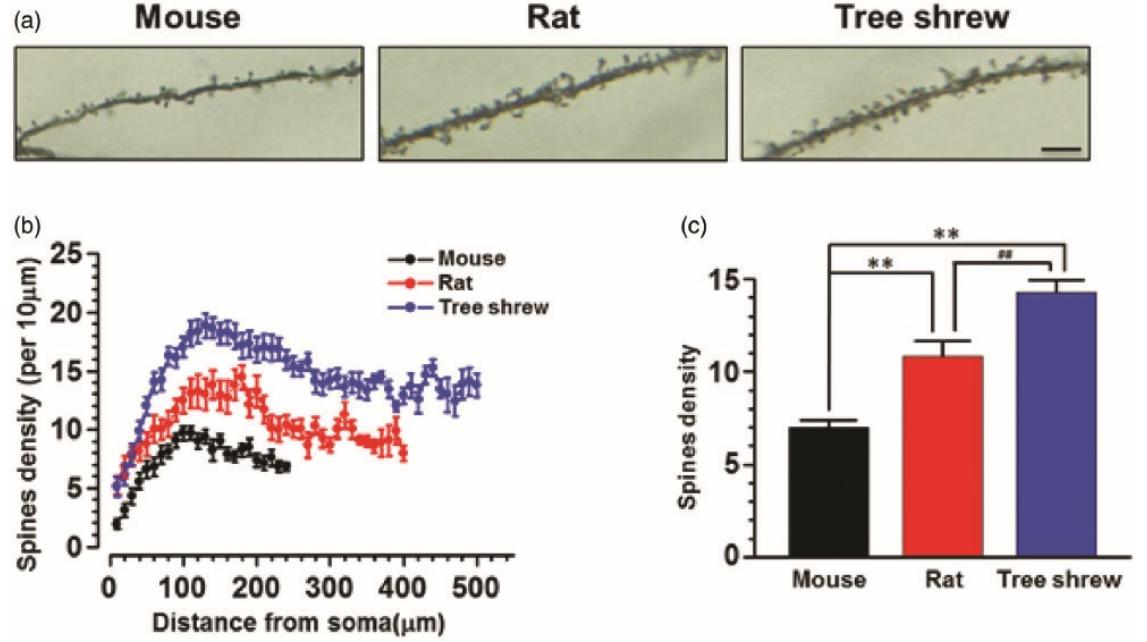
Figure 7. The density of spines in the apical dendrite of layer V pyramidal cell-like neurons in the ACC. (a) Representative figures showing spine distribution in the apical dendrites of ACC neurons from mouse, rat and tree shrew. (b) Pooled data showing the spine density per 10mm along the apical dendrite (n¼27 neurons in mouse and tree shrew, n¼28 neurons in rat). (c) Averaged spine density in the apical dendrite. **p<0.01 in comparison with mouse, ## p<0.01 in comparison with rat.
cover
Figure 1. The anatomical property of the brain in tree shrew. (a) A photo of tree shrew in daily life. (b) Fixed whole brain of mouse, rat and tree shrew. Scale bar, 1cm. The weight (c) and proportion of brain (d) in tree shrew were much larger than that of mouse and rat (n¼9, 9, 8 for mouse, rat and tree shrew), *p<0.05; **p<0.01 in comparison with mouse, ## p<0.01 in comparison with rat. (e) Representative coronal sections of forebrains in mouse, rat and tree shrew. The dash lines delineate ACC regions. Scale bar, 1cm. (f) Sample sections showing the rostral, medium and caudal part of ACC in tree shrew. The integrated ACC was framed by dash lines. (g) The diagram showing the cylinder shape of ACC with sectorial section. S1, rostral areas of ACC; r1, radius of rostral ACC; y1, degree of rostral ACC; S2, caudal areas of ACC; r2, radius of caudal ACC; y2, degree of caudal ACC. Statistic results showing the volume of ACC was progressively increased in mouse, rat and tree shrew (n¼3 in each group), **p<0.01 in comparison with mouse, ## p<0.01 in comparison with rat.
Figure 2. The representative serial sections showing the range of ACC in tree shrew. Sample sections from a stack of 100-mm serial coronal sections. In No. 49 section, prefrontal cortex was indicated by asterisk. Sections from No. 52 to 94 showed the forebrain containing ACC, in which the ACC were framed by dash lines. Sections from No. 104 to 130 showed the forebrain containing posterior cingulate cortex, in which the hippocampus were indicated by stars.
Figure 3. The rostral, medium and caudal part of ACC in tree shrew. Sample sections of Nissl staining showed the rostral, medium and caudal part of ACC in mouse, rat and tree shrew, respectively. The dash lines outline the areas of one side of ACC. Scale bar, 1cm in mouse and 2cm in rat and tree shrew.
Figure 4. The neuronal distribution in the ACC of tree shrew. (a) Fluorescence images of NeuN-immunostained neurons in the ACC of mouse, rat and tree shrew. The frames in (a) were magnified to show the layers II/III (b) and V/VI (c) of the ACC. Scale bar, 100mm in (a) and 20mm in (b–c). (d) Summarized data showing that the neuronal density in layers II/III and V/VI of rat and tree shrew was less than that of mouse (n¼24 slices/4 animals in each group). **p<0.01 in comparison with mouse, # p<0.05, ## p<0.01 in comparison with rat. (e) The neuronal size in layers II/III and V/VI of rat and tree shrew was larger than that of mouse. *p<0.05; **p<0.01.
Figure 5. The distribution of Golgi-stained neuronal profiles in the ACC. (a) Lower magnification figures showing the Golgi impregnated neurons in the ACC of mouse, rat and tree shrew. Dashed lines delineate layer distribution of the ACC. (b) Higher magnification figures showing the neurons in layers II/III and V/VI.
Figure 6. The basal and apical dendritic branches of the layer V pyramidal cell-like neurons in the ACC reconstructed by MOST. (a) Sample figures showing the reconstructed pyramidal cell-like neurons in layer Vof ACC of mouse, rat and tree shrew. (b) Basal (red) and apical (blue) dendritic branches of a sample neuron under a concentric shell template for the Sholl analysis. Curves showed the average number of basal (red) and apical (blue) dendritic intersections per shell. (c) The number of basal and apical dendritic branches per 20mm away from the soma. (d) The average number of basal and apical dendritic branches. **p<0.01 in comparison with mouse, ## p<0.01 in comparison with rat.
Figure 7. The density of spines in the apical dendrite of layer V pyramidal cell-like neurons in the ACC. (a) Representative figures showing spine distribution in the apical dendrites of ACC neurons from mouse, rat and tree shrew. (b) Pooled data showing the spine density per 10mm along the apical dendrite (n¼27 neurons in mouse and tree shrew, n¼28 neurons in rat). (c) Averaged spine density in the apical dendrite. **p<0.01 in comparison with mouse, ## p<0.01 in comparison with rat.
2016年12月,西安交通大学神经元与疾病研究中心卓敏教授课题组,利用MOST技术,结合解剖学、免疫染色等方法,对树鼩 ACC 的形态学特征进行了研究,并与小鼠和大鼠进行了比较。 发现树鼩体内的 ACC 明显大于小鼠和大鼠。,树鼩 ACC 锥体细胞的细胞体积也比小鼠和大鼠的细胞体积大。 此外,树鼩 ACC 锥体神经元的顶端 / 基底树突分支和顶端树突棘明显增多。文章发表在《Mol Pain》杂志上。
参考文献
参考文献[1]:Lu JS, Yue F, Liu X, Chen T, Zhuo M. Characterization of the anterior cingulate cortex in adult tree shrew. Mol Pain. (2016);12:1-11.