

小鼠背中缝核5- 羟色胺神经元的全脑投射
染色方法:
病毒示踪标记
标记方法:
GFP、 YFP、 RFP
包埋方法:
树脂包埋
成像平台:
BioMapping 3000
cover
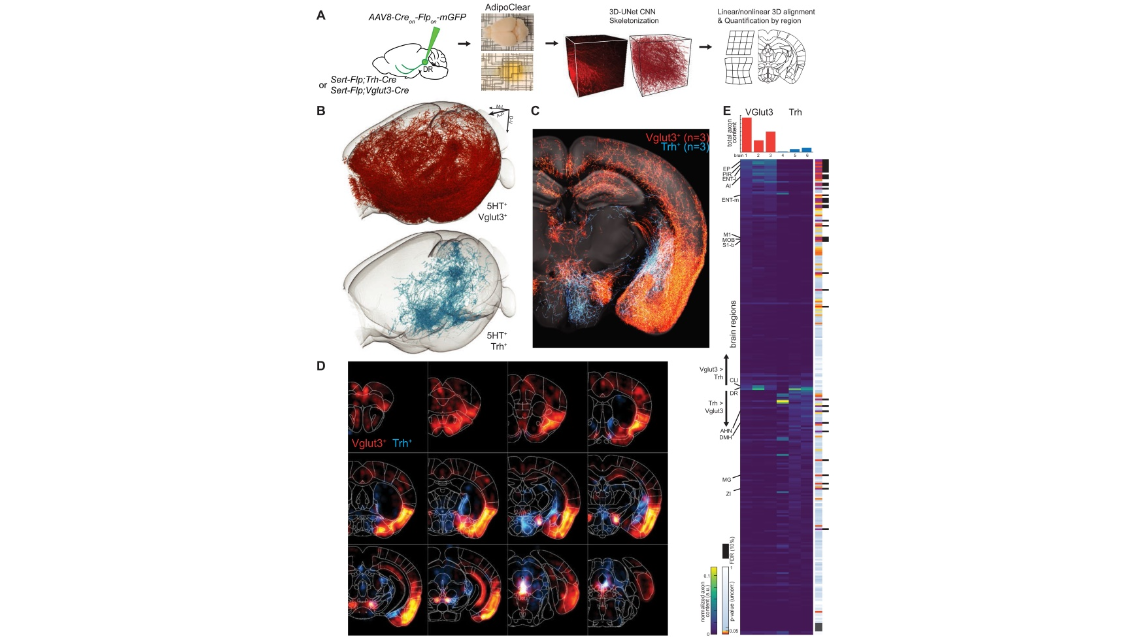
Figure 7. Whole-brain projectome of Trh+ and Vglut3+ serotonin neuron populations. (A) Experimental schematic outlining the intersectional viral strategy, brain clearing, automated 3D axon segmentation, and alignment to the Allen Brain Institute Common Coordinate Framework. (B) Axonal innervation in a 3D view of the left hemisphere of one representative brain each from the intersection of Sert-Flp and either Vglut3-Cre or Trh-Cre. (C) Coronal Z-projection (500 mm of depth) showing axonal innervation patterns of 6 aligned brains. The schematic reference image is one 5 mm thick plane in the middle of the 500 mm stack. (D) Coronal heatmaps of axonal innervation patterns at 12 positions along the rostral–caudal axis for the same six brains as seen in (C). Weightings for individual voxels represent axonal content within a radius of 225 mm. (E) Top, bar plot shows the quantification of total axonal content in each of 6 brains prior to normalization. Bottom, heatmap breaks out the total content into each of 282 individual brain regions using boundaries from the Allen Institute CCF. Values are normalized to both target region volume and total axon content per brain. Display order is grouped by mean normalized prevalence of axons in each genotype and ordered by the second principal component. P-values for individual t-tests are uncorrected; those that survive FDR-testing at 10% are indicated with a black bar. See Supplementary file 5 for full list of regions. EP, Endopiriform nucleus; M1, Primary motor area; S1-B, Primary somatosensory area, barrel field; CLI, Central linear nucleus raphe; AHN, Anterior hypothalamic nucleus; DMH, Dorsomedial nucleus of the hypothalamus; MG, Medial geniculate nucleus; ZI, Zona incerta
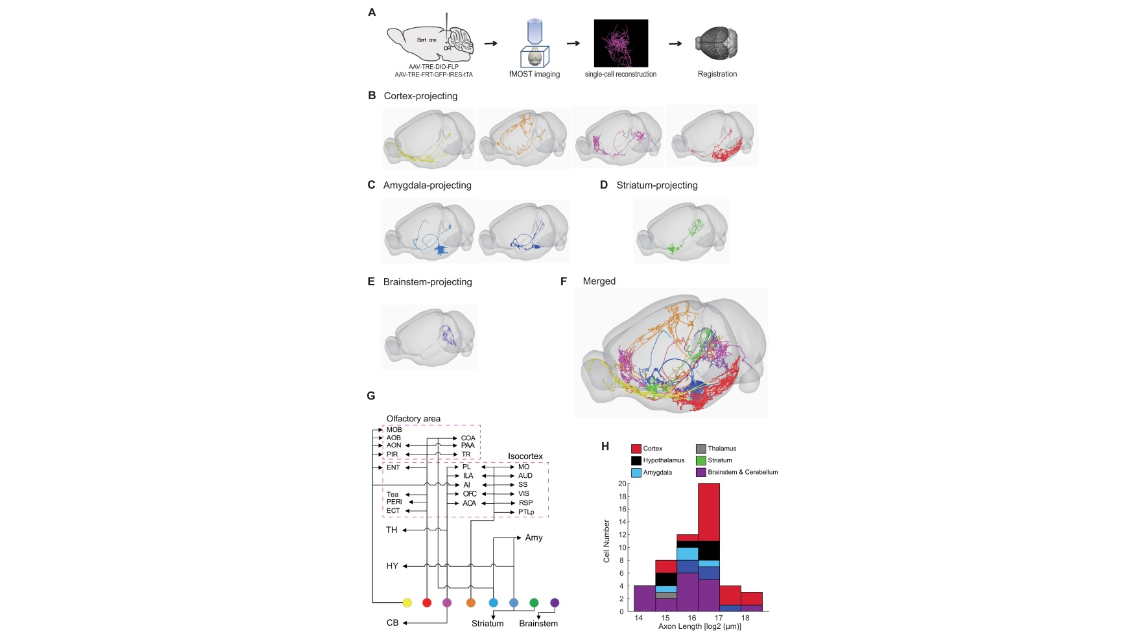
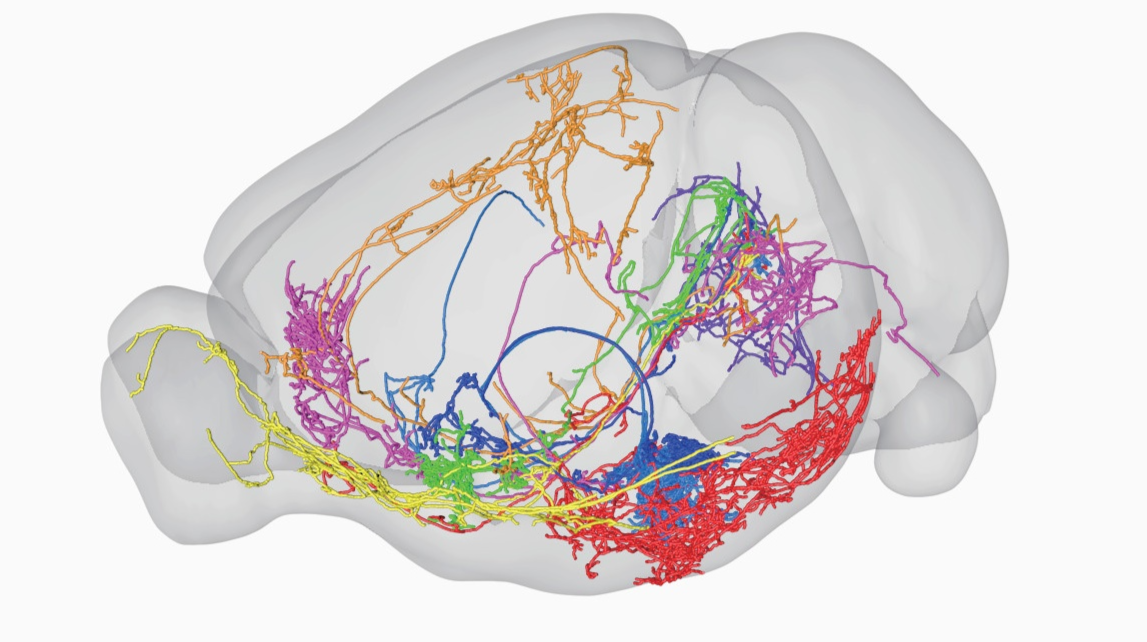
Figure 8. Whole-brain axonal arborization patterns of individual serotonin neurons. (A) Schematic of single-neuron reconstruction pipeline. (B) Four examples of cortex-projecting DR serotonin neurons, projecting primarily to olfactory cortex and olfactory bulb (1st), dorsal cortex (2nd), prefrontal cortex (3rd), and entorhinal cortex (4th). (C) Two examples of amygdala-projecting DR serotonin neurons. (D) A striatum-projecting DR serotonin neuron. (E) A brainstem-projecting DR serotonin neuron. (F) Merged example neurons from panels B–E. (G) Schematic diagram illustrating the major projection targets of 8 sample neurons in panel F. (H) Histogram showing the distribution of cell numbers according to the total axon length.
Figure 7—video 1.Fly-through of aligned axonal projections and heatmaps of the Trh+ and Vglut3+ serotonin subpopulations. Left, individual slice Z projection represent 125 um depth; Right, heat map of axonal densities calculated as described in Figure 7.
Figure 8—video 1. Whole-brain axonal projection patterns of 6 reconstructed dorsal raphe serotonin neurons. Reconstructed serotonin neurons shown in Figure 8A–E were merged and presented in the standard brain, corresponding to Figure 8F.
cover
Figure 7. Whole-brain projectome of Trh+ and Vglut3+ serotonin neuron populations. (A) Experimental schematic outlining the intersectional viral strategy, brain clearing, automated 3D axon segmentation, and alignment to the Allen Brain Institute Common Coordinate Framework. (B) Axonal innervation in a 3D view of the left hemisphere of one representative brain each from the intersection of Sert-Flp and either Vglut3-Cre or Trh-Cre. (C) Coronal Z-projection (500 mm of depth) showing axonal innervation patterns of 6 aligned brains. The schematic reference image is one 5 mm thick plane in the middle of the 500 mm stack. (D) Coronal heatmaps of axonal innervation patterns at 12 positions along the rostral–caudal axis for the same six brains as seen in (C). Weightings for individual voxels represent axonal content within a radius of 225 mm. (E) Top, bar plot shows the quantification of total axonal content in each of 6 brains prior to normalization. Bottom, heatmap breaks out the total content into each of 282 individual brain regions using boundaries from the Allen Institute CCF. Values are normalized to both target region volume and total axon content per brain. Display order is grouped by mean normalized prevalence of axons in each genotype and ordered by the second principal component. P-values for individual t-tests are uncorrected; those that survive FDR-testing at 10% are indicated with a black bar. See Supplementary file 5 for full list of regions. EP, Endopiriform nucleus; M1, Primary motor area; S1-B, Primary somatosensory area, barrel field; CLI, Central linear nucleus raphe; AHN, Anterior hypothalamic nucleus; DMH, Dorsomedial nucleus of the hypothalamus; MG, Medial geniculate nucleus; ZI, Zona incerta
Figure 8. Whole-brain axonal arborization patterns of individual serotonin neurons. (A) Schematic of single-neuron reconstruction pipeline. (B) Four examples of cortex-projecting DR serotonin neurons, projecting primarily to olfactory cortex and olfactory bulb (1st), dorsal cortex (2nd), prefrontal cortex (3rd), and entorhinal cortex (4th). (C) Two examples of amygdala-projecting DR serotonin neurons. (D) A striatum-projecting DR serotonin neuron. (E) A brainstem-projecting DR serotonin neuron. (F) Merged example neurons from panels B–E. (G) Schematic diagram illustrating the major projection targets of 8 sample neurons in panel F. (H) Histogram showing the distribution of cell numbers according to the total axon length.
Figure 7—video 1.Fly-through of aligned axonal projections and heatmaps of the Trh+ and Vglut3+ serotonin subpopulations. Left, individual slice Z projection represent 125 um depth; Right, heat map of axonal densities calculated as described in Figure 7.
Figure 8—video 1. Whole-brain axonal projection patterns of 6 reconstructed dorsal raphe serotonin neurons. Reconstructed serotonin neurons shown in Figure 8A–E were merged and presented in the standard brain, corresponding to Figure 8F.
2019年10月24日,斯坦福大学与武汉光电国家研究中心骆清铭教授团队合作,使用fMOST技术,展示了小鼠背中缝核5- 羟色胺神经元全脑投射,文章发表在《eLife》杂志。
参考文献
参考文献[1]:Ren J et al., Single-cell transcriptomes and whole-brain projections of serotonin neurons in the mouse dorsal and median raphe nuclei. Elife. 2019 Oct 24;8. pii: e49424.